Lessons · Lesson 2 of 3
The chain curve is right and every shop is wrong
Read a size curve as a per-door fact, prove that recorded sales are a biased estimate of demand, and set the rule for when a shop is allowed its own curve.
Lesson 2 of 3 · 38 min
Three shops that were sent the same thing
The obvious way to learn which sizes a shop sells is to look at what it sold. This lesson is about why you cannot trust that answer. A till can only record a garment that was on the shelf to be bought. A size that ran out on Thursday reports the same thing as a size nobody wanted. The question is how far that silent gap bends a business's picture of its customers.
Take three of Brackenhall's grade B shops. Same grade, which at Brackenhall means the same volume band. Same 140 units of SH-4120 in the initial allocation, split the same way. Same engine reading them every Sunday night for fourteen weeks.
- Cardenholt is a city-centre shop with a young, slim customer.
- Netherlaw sits in a large commuter town. It is about as ordinary as a Brackenhall shop gets.
- Piltmoor is a market town with an older, broader customer who has shopped there for twenty years.
Here is what each of them actually wanted. Demand is measured across the season as units sold plus units the shop could not supply.
| Collar | Cardenholt | Netherlaw | Piltmoor |
|---|---|---|---|
| 14.5 | 11% | 4% | 1% |
| 15 | 17% | 9% | 4% |
| 15.5 | 25% | 18% | 11% |
| 16 | 25% | 25% | 20% |
| 16.5 | 14% | 22% | 27% |
| 17 | 6% | 16% | 26% |
| 17.5 | 2% | 6% | 11% |
These are not variations on a theme. Collar 17 is 6% of Cardenholt's shirt demand and 26% of Piltmoor's. That is more than four times the share, in two shops of the same size, forty miles apart. Collar 15 runs the other way by the same margin. No forecasting cleverness is involved in knowing this. It is a fact about who lives near the shop, it is stable year on year, and it was sitting in both shops' till data all along.
The size curve, and the two mistakes people make with it
A size curve — also called a size profile or a size ratio — is the proportion of a style's units in each size. Everything in allocation and replenishment runs on one, whether or not anybody has looked at it lately.
The first mistake is to hold one curve for the chain. The second is subtler and much more common: hold a curve per shop, but build it out of the wrong numbers. This lesson is mostly about the second. The first is easy to argue and almost nobody does anything about it.
Start with the argument that makes people leave the chain curve alone. Here is Brackenhall's chain-level position for SH-4120 across the whole phase.
| Collar | Bought | Wanted |
|---|---|---|
| 14.5 | 5.0% | 5.1% |
| 15 | 10.0% | 9.7% |
| 15.5 | 20.0% | 17.7% |
| 16 | 25.0% | 23.3% |
| 16.5 | 20.0% | 21.3% |
| 17 | 15.0% | 16.4% |
| 17.5 | 5.0% | 6.5% |
Garrow's buy was very nearly right. Across 62 shops the largest error in the chain curve is 2.3 points, on collar 15.5. Judge the size split of this buy the way most retailers judge it — one number for the chain, compared with one number for the chain — and you would call it good work. By that measure it is.
That is the trap, in one table. The chain curve is an average of sixty-two curves. It describes the shop that sits in the middle of them. Netherlaw is close to that shop. Cardenholt and Piltmoor are not, and there are forty-odd shops at Brackenhall further from the middle than Netherlaw is. A curve that is right on average is wrong in every shop except the average one, and the average shop is one shop in sixty-two.
Three shops, three seasons
Same grade, same 140 units, same engine.
| Cardenholt | Netherlaw | Piltmoor | |
|---|---|---|---|
| Units sold | 336 | 342 | 312 |
| Sales it could not supply | 18 | 12 | 42 |
| Units left at the end | 27 | 19 | 41 |
| Where the lost sales were | collars 14.5 and 15 | spread thin | collars 16.5, 17, 17.5 |
| Where the leftovers were | mostly collars 16.5, 17, 17.5 | spread thin | collars 14.5 to 16 |
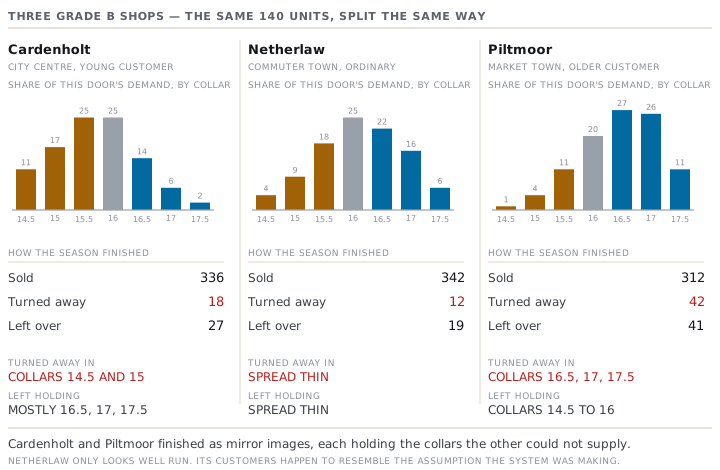
Read the row of lost sales together with the row of leftovers below it. That pairing is the whole subject. Cardenholt finished the season having turned away 18 customers who wanted a small collar, while holding 21 shirts in the three largest collars. Piltmoor turned away 42 customers who wanted a large collar, while holding 41 shirts in the four smallest. The two shops finished as mirror images. Between them they were sitting on the answer to each other's problem, with no warehouse involved and no replenishment engine able to reach it. Once the stock is in the shop, the only route from Piltmoor's surplus to Cardenholt's shortage runs through a transfer somebody has to pay for.
Netherlaw looks like a well-run shop. It is not. Its customers happen to resemble the assumption the system was making. It would have finished exactly this well under any engine at all.
Recorded sales are not demand, and the gap has a direction
Now the harder half. This is why a retailer that decides to build per-store curves can still build wrong ones.
You cannot measure demand. You can only measure sales, and a sale needs a shirt to be present. A size that is out of stock records zero, and in a report a zero looks exactly like a size nobody wants. That is called censoring, and its effect on a size curve has a direction. It always pulls the measured curve towards the shape of whatever you sent.
Put Brackenhall's tills next to its customers.
| Collar | Bought | Tills recorded | Wanted |
|---|---|---|---|
| 14.5 | 5.0% | 4.5% | 5.1% |
| 15 | 10.0% | 9.7% | 9.7% |
| 15.5 | 20.0% | 19.0% | 17.7% |
| 16 | 25.0% | 25.0% | 23.3% |
| 16.5 | 20.0% | 21.3% | 21.3% |
| 17 | 15.0% | 15.4% | 16.4% |
| 17.5 | 5.0% | 5.1% | 6.5% |
Take collar 17.5. Customers wanted 6.5% of the style in that collar. Brackenhall sent 5.0%. The tills reported 5.1%. They closed 7% of the gap between the shape that was sent and the shape that was wanted. They handed back, to within a rounding error, the number they had been given. A merchandiser rebuilding next year's curve from this year's sales would look at 5.1%, decide that 5% was about right, and buy the same shortage again.
Then take collar 16. This is the part almost nobody has thought about. Nobody ever ran out of collar 16 anywhere. Its recorded share is 25.0% against a true demand share of 23.3%. The tills over-reported a size that was never short. Why? A share is a ratio. Hold down the sales of three sizes and every remaining size's share rises, without one extra shirt being sold. Censoring in one size corrupts the measured share of every other size, including the ones that never broke.
Collar 14.5 shows the same mechanism running the other way. The tills recorded 4.5% against demand of 5.1%, because 14.5 broke late in the season at the city shops, where almost all of its demand lives. So the censoring is geographic as well as dimensional, and a chain-level table cannot see either.
Building a curve you can actually use
Four rules. The fourth is the one that stops the whole exercise turning into noise.
- Measure on in-stock weeks only. For each size, use only the weeks in which the shop held at or above its presentation minimum in that size for the whole week. A week in which a size ran out on Thursday is thrown away, not scaled up. You do not know what would have happened on Saturday, and a guess entered as data becomes a fact by the time somebody else reads it.
- Net of returns. A curve built from gross sales overstates every size whose customers bracket-buy: order two collars, keep one. Menswear shirts get bracket-bought less than most garments, but it does happen. Returns are course 18.5's subject. The rule here is only that you use the same window and the same net basis for every size, and that you say which.
- Rebuild it twice a season, not once a year. A curve is a fact about a catchment, and catchments move. An office block opens. A school closes. A competitor two doors down shuts and hands you their customer.
- Require enough evidence, and pool the shops that do not have it. This is the rule people skip.
The evidence rule, and why it matters more than the theory
A grade D Brackenhall shop sells eight shirts of this style in a good week. Across four weeks and seven sizes, that is under four units a size. A size curve built from three or four observations is not a measurement. It is a random number with a percentage sign after it. Applying it will do more damage than the chain curve did, because at least the chain curve is stable.
So Brackenhall's rule is written as a threshold, and it is checkable:
A shop gets its own curve when it has sold at least 60 units of the style with every size in stock for at least 8 of the measured weeks. Below that, it takes the curve of its profile group — city, market town or average. Not the chain curve, and not a curve borrowed from one neighbouring shop.
The profile groups are a trade Brackenhall makes deliberately, and it is worth naming the trade rather than pretending it is free. The chain curve is biased and stable. A small shop's own curve is unbiased and noisy. Pooling shops by customer profile is the middle path. It recovers most of the bias, because a market-town group is nothing like a city group. And it keeps enough sales behind each figure to mean something. Twenty-three of Brackenhall's shops are market town. That is 5,300 units of evidence a season, instead of the one or two hundred a single small shop manages.
What none of this can do
Everything in this lesson improves the shape of what a shop is sent. None of it creates a shirt. If the buy is short in collar 17 at chain level, a perfect set of sixty-two curves moves the shortage around the estate more intelligently. It does not reduce it by one unit. Lesson 3 puts a number on both halves: what better curves were worth at Brackenhall, and what a spreadsheet already decided last October.
Check yourselfA colleague rebuilds every door's size curve from last season's sales and reports that most doors came out close to the chain curve, so the exercise was not worth doing. What is wrong with that conclusion?Show the answer
The allocation itself pulled the measured curves towards the chain curve. That is the finding, not a reason to stop. Every shop was sent the chain shape. Sizes that were short of it ran out and recorded no further sales. So the sales data from every shop partly reports the shape it was given, rather than the demand it faced. The test is not whether the measured curves resemble the chain curve — they will. The test is whether they resemble it after the out-of-stock weeks are excluded. Rerun it on in-stock weeks only, and check separately how many shop-weeks were thrown away. If a shop lost half its weeks in a size, the remaining half is what you have. It is still better than a number built from the weeks the shelf was empty.
Prompt · Rebuild my size curves from in-stock weeks, and tell me which shops have earned one
Before you let per-shop size curves loose on a replenishment engine, when you need to know which of them are measurements and which are noise.
Act as a retail planning analyst who knows that recorded sales are a censored estimate of demand and treats every curve as guilty until the out-of-stock weeks are excluded. Here is my data for one style, one row per door per size per week: units sold, units on hand at the start of the week, and the presentation minimum for that door and size: [PASTE]. My chain size curve as bought was [PASTE]. Do the following. First, for each door and size, mark every week as IN STOCK or NOT: in stock means the door held at or above its presentation minimum in that size for the whole week. Throw the rest away rather than scaling them up. Tell me how many shop-weeks you discarded, in total and for the worst ten shops. Second, rebuild each shop's size curve from the in-stock weeks only, and put it beside the curve you would get from all weeks. I want to see how far the censoring moved it, per size, in percentage points. Third, at chain level, put three curves side by side: as bought, as recorded by the tills, and as measured on in-stock weeks. For each size, tell me what share of the gap between the bought shape and the measured shape the tills actually closed. Name any size where the tills handed back, to within a rounding error, the number they were sent. Fourth, apply an evidence threshold I will set - [NUMBER] units sold with every size in stock for at least [NUMBER] of the measured weeks - and split my shops into those that have earned their own curve and those that have not. Fifth, propose profile groups for the shops that have not earned one. Use the shape of their measured curves, not their volume. Tell me how many units of evidence sit behind each group, and mark every assignment provisional so I can review it. Do not tell me the shop curves resemble the chain curve and stop there. That is what censoring produces. It is the finding, not the conclusion.
AI can make mistakes — check anything you act on.