Lessons · Lesson 3 of 3
Sold out and overstocked at the same time
Trade the phase out to clearance, watch every size end the season simultaneously short in some doors and dead in others, and price how much of the loss was still recoverable at the holdback release.
Lesson 3 of 3 · 40 min
Monday 26 October 2026: the week 8 read
A season ends, the report says the style sold well, and everybody moves on. What the report cannot show is the shape of what was left. A chain can be short of a garment and stuck with it in the same week. It happens in different shops, and the two cancel out in any total anybody prints. This lesson closes the phase out and prices what the unsold stock fetched.
Eight weeks in, and the sheet in front of Iona Ockridge and Ambrose Renshold says the Tetherby crew is working.
| Plan | Actual | |
|---|---|---|
| Units sold | 1,170 | 1,165 |
| Units allocated | 1,944 | 1,944 |
| Sell-through | 60.19% | 59.93% |
| Units on hand | 774 | 779 |
Sell-through is the share of what the shops received that they have sold. Five units behind on 1,170 is four tenths of one per cent, across 42 shops and eight weeks. The phasing was right, the depth was right, the buy was right. Nobody in the room has anything to raise.
There is a second figure on the sheet and it reads as good news too: 21 of the 42 shops are already out of at least one size. In a room that has been trading knitwear for years that is the shape of a winner — half the estate selling to zero somewhere by week 8, on a style with a holdback still to come. Not one of the 42 is out of a size 12 or a size 14, the two sizes that are 48% of chain demand, so the core of the run is intact everywhere.
Ambrose asks whether there is time to repeat. There is not: the mill is 22 weeks out and the phase ends in January. The conversation moves on to the holdback.
The holdback goes out
The 810 units held back release on the Monday of week 9. The rule Haldencote applies is the rule it applied in August: divide by measured grade share, split by the chain size curve.
That gives 52 units to each A door, 23 to each B and 8 to each C. Check it: 6 at 52 is 312, 14 at 23 is 322, and 22 at 8 is 176, which is 810. On the chain curve an A door's 52 units come out as 4, 9, 14, 12, 8 and 5.
Every shop in the estate now holds, over the phase, exactly what its measured share of the chain's knitwear says it should, in exactly the mix the chain sells. The system has done what it was asked to do, twice.
Week 20: the season closes
Week 20 is the week commencing 11 January 2027. What follows is Haldencote's post-season reconstruction, and it rests on one stated assumption: a shopper who could not find her size in a shop is counted as having bought nothing. That is deliberately cautious. It ignores the customer who buys it online instead. It also ignores the opposite and larger effect — a rail missing its three best sizes stops selling the sizes it still has, because it looks picked over. Neither is in the numbers below.
| Units | |
|---|---|
| Allocated and released to shops | 2,754 |
| Reconstructed demand | 2,604 |
| Sold at full price | 2,347 |
| Demand that found no garment | 257 |
| Left at the end of the phase | 407 |
Full-price sell-through is 2,347 divided by 2,754, which is 85.22% — a number most knitwear buyers would sign for. The plan for the phase was 2,600 units and the reconstructed demand was 2,604. Ambrose's forecast was wrong by four units in twenty-six hundred, and the season still ended with 257 shoppers who wanted the jumper and 407 jumpers nobody wanted.
Those two figures are the point of the course. They are not a contradiction and they are not two separate problems. They are the same units, in the wrong buildings.
Every size, on both sides of the line
Break the 407 and the 257 down by size and the pattern is not subtle.
| Size | Units left | Demand unmet | Doors that sold out | Doors still holding it |
|---|---|---|---|---|
| 8 | 80 | 52 | 18 | 24 |
| 10 | 74 | 57 | 26 | 16 |
| 12 | 53 | 16 | 22 | 20 |
| 14 | 55 | 28 | 22 | 20 |
| 16 | 78 | 54 | 22 | 20 |
| 18 | 67 | 50 | 22 | 20 |
| All | 407 | 257 |
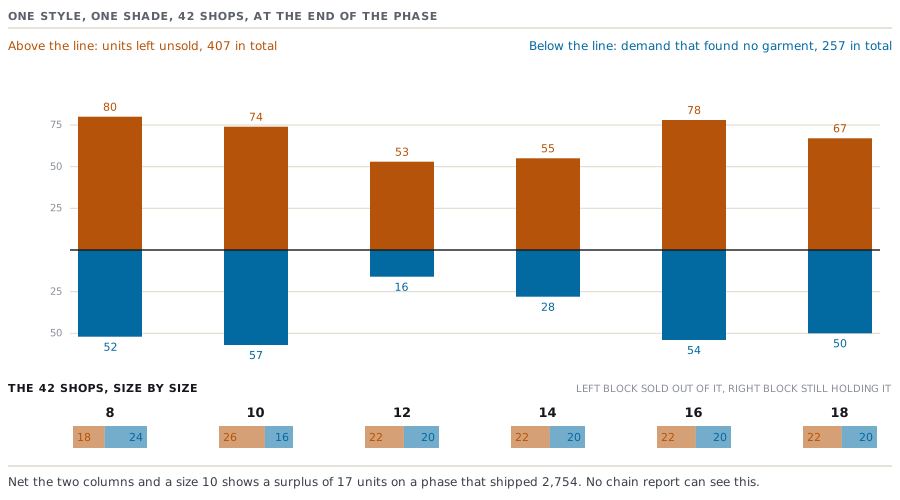
There is no size in the run that the chain was short of, and no size it had too much of. Every single size was both, in different shops, at the same time. Size 10 is the clearest: 26 shops had sold their last one and 16 were still holding 74 between them, while 57 shoppers across the estate went home without one.
A chain-level report cannot see any of this. Set the two columns against each other and size 10 shows a surplus of 17 units on a phase that shipped 2,754 — well inside the noise of any report anybody runs.
Two shops, the same 33 units
Return to the two A doors from lesson 2. Both were graded at 6.17%. Both were allocated 120 units in August and 52 in week 9. Both sold 139 units over the phase. Both ended the phase holding 33.
| 8 | 10 | 12 | 14 | 16 | 18 | Total | |
|---|---|---|---|---|---|---|---|
| Cranmoor Street, demand | 24 | 40 | 47 | 29 | 14 | 6 | 160 |
| Cranmoor Street, left | 0 | 0 | 0 | 9 | 13 | 11 | 33 |
| Netherbrook, demand | 2 | 18 | 37 | 41 | 37 | 25 | 160 |
| Netherbrook, left | 12 | 13 | 8 | 0 | 0 | 0 | 33 |
Two shops of identical grade, identical allocation, identical sales and identical leftovers — and the leftovers are mirror images. Cranmoor Street's 33 are the three largest sizes it was never going to sell. Netherbrook's 33 are the three smallest. Each shop was holding, all season, precisely what the other one had run out of.
Across the whole estate, 22 of the 42 doors finished the phase holding stock and holding none at all of either of their own two best-selling sizes. That is what a broken size run is: a unit count that looks healthy, a rail that is dead. The units are in the system, they are in the stock file, they are in the WSSI — the weekly sales, stock and intake report a retailer trades from — and none of them is sellable at the price on the ticket.
What it cost
Everything left over went into the January clearance at 50% off, so a GBP 79.00 ticket cleared at GBP 39.50 against a landed cost of GBP 27.65.
| Units | Value | |
|---|---|---|
| Sold at full price | 2,347 | GBP 185,413.00 |
| Sold in clearance | 407 | GBP 16,076.50 |
| Total revenue | 2,754 | GBP 201,489.50 |
| Cost of goods | 2,754 | GBP 76,148.10 |
| Margin | GBP 125,341.40 |
Check the arithmetic: 2,347 at GBP 79.00 is GBP 185,413.00; 407 at GBP 39.50 is GBP 16,076.50; 2,754 at GBP 27.65 is GBP 76,148.10. The intake margin was 65.0%; the achieved margin is 125,341.40 divided by 201,489.50, which is 62.21%.
2.79 points of margin, and not one of them was given away in a markdown decision. The clearance was taken in the last week of the phase at the standard rate. The gap between what the buyer bought at and what the department earned was created entirely in a spreadsheet in August, by somebody dividing a number by a share.
How much was still recoverable, and when
The review ran the phase again twice, changing one thing each time.
Run one: reshape the holdback. Keep the August allocation exactly as it went out. Then at week 9 send each door its 52 or 23 or 8 units in the mix that door had actually sold in weeks 1 to 8, rather than the chain mix. Cranmoor Street's 52 becomes 7, 13, 15, 10, 5 and 2 instead of 4, 9, 14, 12, 8 and 5. Netherbrook's becomes 1, 6, 12, 14, 11 and 8.
Run two: use each door's own curve from the start, in August, for both the initial allocation and the release. Nothing else changes — same buy, same grades, same depths, same presentation minimum, same demand.
| Sold at full price | Left to clear | Margin | Achieved margin | |
|---|---|---|---|---|
| What happened | 2,347 | 407 | GBP 125,341.40 | 62.21% |
| Holdback reshaped at week 9 | 2,435 | 319 | GBP 128,817.40 | 62.85% |
| Own curve from August | 2,578 | 176 | GBP 134,465.90 | 63.84% |
Getting the shape right in August was worth 231 units and GBP 9,124.50. Getting it right at week 9, with the only lever anybody still had, was worth 88 units and GBP 3,476.00 — 38% of the prize, and the other 62% was gone before the shops opened on the first Saturday.
That ratio is the honest answer to the question every allocator is asked in November. There is always something worth doing with the stock that is left, and it is always a minority of what was available in August.
The mistake nobody made
Set out every decision in this course in order, and ask which one you would reverse.
- Buy 3,240 units of the Chalkstone shade. Right: reconstructed demand across shops and website came within four units of the plan.
- Hold 25% back for a week 9 release. Right, and standard: it is what made runs one and two possible at all.
- Grade the doors on measured share of last autumn's knitwear units. Right, and better than most estates manage.
- Split the intake in proportion to that share. Right: it gave every door in the estate 13.3 weeks of cover.
- Use a chain size curve rebuilt each February from actual sales. Right: the curve was accurate to the decimal place, and this lesson's own reconciliation proves it.
- Hold a presentation minimum of 2 per size so no shop shows a gapped rail. Right, and store managers would fight to keep it.
Six defensible decisions, no dissent, no error, and a season that gave away GBP 9,124.50 on one shade of one style. Multiply it across a knitwear department and it stops being a rounding difference.
The failure is not in any of the six. It is in the join between decision 4 and decision 5 — a depth decided per door and a shape decided per chain. Nothing in the process owns that join, because it is not a decision anybody makes. It is a default that survives by never being written down as a choice.
Check yourselfYour chain sell-through on a style is 85% at the end of the phase and your buyer wants to repeat it next season at a bigger buy. What do you need to look at first, and what would change your answer?Show the answer
Split the units left and the demand unmet by size and by door before you look at the chain figure again. An 85% sell-through built from doors that each sold what they were sent is a genuinely strong style, and the repeat is easy. An 85% built from half the estate running out in week 6 while the other half cleared the same sizes in January is a style whose true demand you have never measured, because every door that sold out stopped reporting. In the second case a bigger buy allocated the same way produces a bigger version of the same result, and the thing to fix is not the quantity. The test that separates them is the one in this lesson: count how many doors ended the phase holding stock and none of their own best sizes. If that number is small, repeat it. If it is half the estate, you do not yet know what the style is worth.
Prompt · Reconcile what I have left against what I never sold
At the end of a phase, or at a holdback release, when the chain sell-through looks acceptable and you need to know whether the estate is actually healthy.
Act as a retail planner running a post-phase reconciliation, and assume the chain figure is hiding the answer. Here is my position, by shop and by size: [PASTE - SHOP, SIZE, UNITS RECEIVED, UNITS SOLD, UNITS ON HAND, AND THE WEEKS THAT SIZE WAS AT ZERO STOCK]. My ticket is [AMOUNT], my landed cost is [AMOUNT], my clearance price is [AMOUNT], and my phase ran [NUMBER] weeks. Do the following. First, reconstruct unmet demand per shop per size by adding back that size's own weekly rate for the weeks the shop held none of it, and state that assumption in one line before you use it, including that it counts a shopper who could not find her size as buying nothing. Second, give me a table by size showing units left, demand unmet, how many shops sold out of it and how many are still holding it, and tell me any size that is on both sides at once. Third, net the two columns per size and show me the netted figure a chain report would print, so I can see what it hides. Fourth, count the shops that end holding stock but none at all of either of their own two best-selling sizes, and list the worst ten by name. Fifth, price it: full-price sales at my ticket, leftovers at my clearance price, cost of goods on everything, my achieved margin, and the gap to my intake margin. Sixth, re-run the same demand against an allocation built on each shop's own curve at the same depths, and tell me the difference in units and in margin. Seventh, if I still have units in the warehouse, tell me where to send them, and tell me if the right answer for some of them is to send none. Show every calculation. Do not tell me the sell-through is good.
AI can make mistakes — check anything you act on.