Lessons · Lesson 2 of 3
A curve that is right on average is wrong in every door
Rebuild a chain size curve from the doors it was averaged from, watch it reconcile exactly and describe none of them, and price what a presentation minimum costs in a door that never sells the size.
Lesson 2 of 3 · 40 min
The number nobody had ever questioned
For every delivery, a retailer decides how many of each size to send. Almost all of them settle it with one set of proportions taken from last year's sales. Those proportions are measured across the whole chain. This lesson asks whether such a figure can honestly be used inside one branch. It then turns to the rule that no shop may show fewer than a stated number of a size.
Haldencote's womenswear knitwear size curve is 8% in a size 8, 18% in a 10, 26% in a 12, 22% in a 14, 16% in a 16 and 10% in an 18. It has been in the allocation system for four years. It is reviewed every February and rebuilt from the previous autumn's actual unit sales. In the post-season review this lesson is written from, it was checked again and found correct to the last decimal place.
That is worth sitting with before anything else, because this course is not arguing that somebody used a wrong number. The curve is right. It is right about the chain, it has always been right about the chain, and that is why the whole system was trusted.
Where a chain curve comes from, and why it is trustworthy at chain level
A size curve — also called a size profile or a size ratio — is the proportion of a style's units in each size. Haldencote builds its own by taking every knitwear unit sold across the estate in the equivalent phase last autumn, and expressing each size as a share of the total.
That method has one real weakness and one real strength. Knowing which is which is most of this lesson.
The weakness is that sales are not demand. A door that sells its last size 12 in week 6 records no further size 12 sales for the rest of the phase. The shoppers who wanted one and left do not appear in any file. Statisticians call an observation like that censored: the event kept happening, the measurement stopped. Every allocator who has tried to build a curve from one shop's sales has run into it. It is the honest reason Haldencote never had door-level curves. A single door's figures look unreliable, because they are.
The strength is that at chain level the censoring largely cancels out. The size 12 that Cranmoor Street ran out of in week 6 was sitting unsold in Netherbrook in week 19, and both facts land in the same chain total. Add up a censored measurement over enough doors that were short and doors that were long, and what comes out is close to the truth. So the chain curve was reliable, everybody knew it was reliable, and the natural next step — that it was therefore the safe thing to allocate on — is the false one.
Rebuilding the curve from the doors it came from
In the post-season review Haldencote did something it had never done. It reconstructed each door's demand rather than its sales. It took the door's unit sales week by week, and for any week in which a size was at zero stock, it added back that size's average weekly rate from the weeks the door did hold it. It is a rough method and the review said so. It is also the only way to see past the censoring, and it produced a clear result: the 42 doors fall into three distinct shapes.
| Profile | Doors | 8 | 10 | 12 | 14 | 16 | 18 | What kind of shop |
|---|---|---|---|---|---|---|---|---|
| Small-skewed | 14 | 15% | 25% | 29% | 18% | 9% | 4% | City-centre and university towns |
| Chain-shaped | 14 | 8% | 18% | 26% | 22% | 16% | 10% | Suburban and larger regional |
| Large-skewed | 14 | 1% | 11% | 23% | 26% | 23% | 16% | Market towns and coastal |
The even split into fourteens is where the cut-offs happened to fall. It is not a design. What matters is the middle row: one of the three profiles is the chain curve, exactly. A third of the estate is genuinely described by the number that was allocated to all of it, which is precisely why the practice never produced an obvious failure.
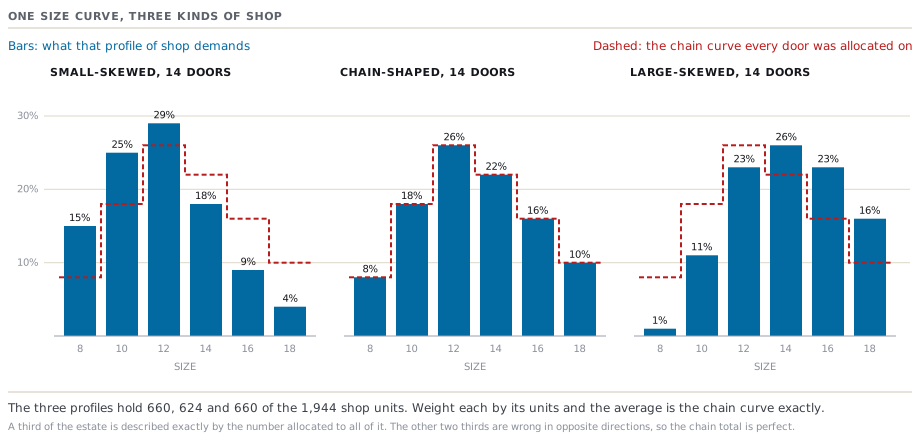
Now the reconciliation, which is the part to do by hand once. The three profiles do not carry equal weight, because they hold different numbers of units: the small-skewed doors hold 660 of the 1,944 shop units, the chain-shaped ones 624, and the large-skewed ones 660. Weight each profile by its units and average.
| Size | Small-skewed, 660 units | Chain-shaped, 624 units | Large-skewed, 660 units | Weighted total | Divided by 1,944 |
|---|---|---|---|---|---|
| 8 | 9,900 | 4,992 | 660 | 15,552 | 8% |
| 10 | 16,500 | 11,232 | 7,260 | 34,992 | 18% |
| 12 | 19,140 | 16,224 | 15,180 | 50,544 | 26% |
| 14 | 11,880 | 13,728 | 17,160 | 42,768 | 22% |
| 16 | 5,940 | 9,984 | 15,180 | 31,104 | 16% |
| 18 | 2,640 | 6,240 | 10,560 | 19,440 | 10% |
Take the size 8 row: 660 doors-worth of units at 15% is 9,900, 624 at 8% is 4,992, 660 at 1% is 660, and those add to 15,552. Divide by 1,944 and you get 8.0000 — the chain curve, exactly, with no rounding at all. Every other row does the same.
The chain curve is the arithmetic mean of three shapes, and it is not any of them. That is not a rough edge that better data would tighten. It is what an average is.
Two shops, one carton spec
Follow two of the six A doors. Cranmoor Street is Haldencote's largest shop, a city-centre flagship whose knitwear demand is small-skewed. Netherbrook is a market-town door doing almost identical knitwear volume — both are graded A at 6.17% — whose demand is large-skewed.
Both were allocated 120 units in the same shape, because the shape came from a field on the style record rather than from either shop.
| 8 | 10 | 12 | 14 | 16 | 18 | Total | |
|---|---|---|---|---|---|---|---|
| Allocated to both | 10 | 22 | 31 | 26 | 19 | 12 | 120 |
| Cranmoor Street would have taken | 18 | 30 | 35 | 21 | 11 | 5 | 120 |
| Netherbrook would have taken | 2 | 13 | 28 | 30 | 28 | 19 | 120 |
Read the Cranmoor row against the allocation: 8 units short in a size 8, 8 short in a 10, 4 short in a 12, and then 5, 8 and 7 units too many in the three largest sizes. Add up the overs and you get 20 units of the 120 standing in sizes this shop sells least — one garment in six — with the identical 20 units missing from the sizes it sells most.
Now read Netherbrook, and it is the same sentence with the sizes reversed. There are 8 too many in a size 8, 9 too many in a 10 and 3 too many in a 12, and 4, 9 and 7 short at the top of the run. Also 20 units.
What a presentation minimum costs, and where
Lesson 1 set a presentation minimum of 2 units per size per door, so no shop shows a rail with a hole in it. On the chain curve it never bit — the smallest cell in the whole estate was exactly 2. Change the curve to each door's own and it starts biting immediately. Where it bites is instructive.
Netherbrook's own curve puts 1% of its demand in a size 8. On 120 units that is 1.2 garments. The minimum forces it to 2, and the extra unit has to come from somewhere, so the size 14 goes from 31.2 down to 30. That is cheap: one unit in 120.
A large-skewed C door is a different matter. Its depth is 20 units, so 1% is 0.2 of a garment — largest remainder would send it none at all. The minimum forces 2, and the arithmetic takes those units off the two sizes with the most to give.
| 8 | 10 | 12 | 14 | 16 | 18 | Total | |
|---|---|---|---|---|---|---|---|
| Own demand curve | 1% | 11% | 23% | 26% | 23% | 16% | 100% |
| Exact on 20 units | 0.2 | 2.2 | 4.6 | 5.2 | 4.6 | 3.2 | 20.0 |
| Largest remainder | 0 | 2 | 5 | 5 | 5 | 3 | 20 |
| With the minimum applied | 2 | 2 | 4 | 4 | 5 | 3 | 20 |
Two of this shop's 20 units — a tenth of everything it will hold of this style all season — are a size that shows up in its demand once in a hundred garments. That is not a mistake and it should not be removed. A customer who walks a rail and sees the run starting at a 10 decides the shop has been picked over, and that cost is real and impossible to measure. But it should be named, priced and decided, rather than arriving as a side effect of a rule nobody re-reads. Haldencote's decision, taken in the review, was to keep the minimum at 2 for sizes inside a door's own selling range. It drops to 1 for a size below 2% of that door's demand, which recovers roughly one unit per small door.
What this lesson has and has not shown
It has shown that the chain curve is arithmetically the average of three real, different shapes, and that applying it to a door costs about one garment in six standing in the wrong size. It has not shown that this costs money. A unit in the wrong size in September is only a loss if it is still there in January, and 20 misplaced units in a door that has 810 more coming in week 9 might be nothing at all.
Lesson 3 trades the whole 20 weeks and finds out.
Check yourselfA colleague argues that door-level size curves are unreliable because a door that sells out of a size under-reports its demand for it, and that the chain curve is therefore the safer number. Where is the error?Show the answer
Both halves of the observation are correct and the conclusion does not follow. Door-level sales really are censored, and that is exactly why Haldencote had never built door curves. But the chain curve is not a less censored measurement of the same thing. It is a measurement of a different thing — the mix the whole chain sells — and no door sells that mix. Choosing it does not reduce the error, it moves it: instead of a noisy estimate of the right quantity you now have a precise estimate of the wrong one, and the precision is what makes it hard to argue with. The answer to censored data is to reconstruct the demand behind it, as the review did by adding back a size's own rate for the weeks the door held none of it. A rough figure aimed at the right question beats an exact one aimed at the wrong question, and this is the one case in retail arithmetic where that is reliably true.
Prompt · Tell me whose size curve I am about to allocate
Before an initial allocation goes out on a single curve held on the style record or the department, and nobody can say which shops it describes.
Act as a retail allocation analyst whose first assumption is that a single size curve describes no individual shop. My curve is [PASTE - SIZE AND PERCENT FOR EVERY SIZE IN THE RUN] and I am about to allocate [NUMBER] units across [NUMBER] shops at depths of [PASTE DEPTH PER GRADE]. Here is what each shop sold by size over the equivalent phase last year: [PASTE - SHOP, THEN UNITS SOLD IN EACH SIZE]. If I also have the weeks in which a shop held zero stock of a size, here they are: [PASTE OR SAY NONE]. Do the following. First, tell me whether my curve is genuinely the unit-weighted average of my shops' own curves - compute it and show the row for each size - and say clearly that reconciling proves the curve accurate about the chain and proves nothing about any shop. Second, reconstruct demand rather than sales wherever I gave you zero-stock weeks, by adding back that size's own average weekly rate from the weeks the shop held it, and say how rough that estimate is. Third, cluster my shops into no more than four size profiles, name what kind of shop each profile is, and give the curve and the door count for each. Fourth, for the two shops furthest from the chain curve, show what they would be sent on my curve against what their own curve would send, and count the units standing in sizes each sells least. Fifth, apply my presentation minimum of [NUMBER] per size and tell me exactly where it binds and what it costs in each door, as units and as a share of that door's depth. Sixth, if a shop's sales are too thin to build a curve from, say so and tell me what you would use instead. Do not invent a profile for a shop you cannot see enough of.
AI can make mistakes — check anything you act on.