Lessons · Lesson 1 of 3
A return is not a sale reversed
Read a return rate that is still moving, separate the returns you have earned from the returns you have received, and watch a blended rate rise 3.3 points while nothing about the product changes.
Lesson 1 of 3 · 30 min
The situation
It is easy to think of a returned garment as a sale that never happened. It is not that tidy. The money goes back days or weeks after you took it. The garment is out of the business for all of that time. It reaches a shelf again in a different week from the one it was sold in. That delay is what this lesson is about.
Monday 30 November 2026, an office over the goods yard at the distribution centre. The DC is the warehouse that supplies every shop and packs every web order. Ashmoor is a footwear retailer: 46 shops across Britain and Ireland, and a website that sells more pairs than any four shops together.
The style is AM-4120, called the Coldbeck. It is a women's leather Chelsea boot. The ticket price is GBP 129.00. The landed cost — what the boot costs delivered into the warehouse, freight and duty included — is GBP 47.73. That is a 63.0% intake margin. It is bought in six UK sizes, 3 to 8. The autumn phase ran twelve weeks, from the week beginning 7 September to the week beginning 23 November 2026. It closed yesterday.
Three people share the style. Priya Ardenshaw bought it. Freya Kilvington allocates it to shops and replenishes them. Owen Skelbrook runs the returns bay at the DC, where every web return in the business lands. Everything below is Ashmoor measuring its own trade. None of it is an industry figure, and none of it should be lifted into your business without measuring yours.
This course is kept in units, with money attached at the end. Returns are a unit problem before they are a money problem. Where a figure is at retail or at cost, it says so.
The identity, and the row a WSSI does not have
Course 17.2 gave you the weekly identity: closing stock equals opening stock plus intake, less sales, less markdown. A WSSI — the weekly sheet of sales, stock and intake — is built on it. A returns course has to add one more term, in units:
closing units = opening units + intake units − gross sales units + returns put back into sellable stock
Four things follow at once, and they are the whole lesson.
- Gross sales and net sales are two different rows, not two names for one row. Gross is what left the building. Net is gross less what came back. A sell-through quoted on gross is not so much wrong as early.
- A return comes back into stock late. It is not a sale un-happening. It is a despatch, then a decision by the customer days later, then a carrier leg, then a queue in the returns bay, then an inspection. The unit is out of stock for all of that.
- Not everything that comes back goes back. The term above says put back into sellable stock, not received. Lesson 2 is entirely about the gap between the two, and it is wider than most people expect.
- The return arrives in a different week from the sale it belongs to. That one fact is what makes a return rate so easy to read wrongly, and it is what the rest of this lesson is about.
Two return rates, and only one of them holds still
The definition is simple arithmetic:
return rate % = units returned ÷ units sold × 100
The trouble is that "returned" and "sold" can be counted in the same week, or each in the week it belongs to. The two ways give different answers for months.
- The received-basis rate divides the returns that arrived this week by the sales that happened this week. Every returns report starts life this way, because both numbers are lying on the desk.
- The cohort rate divides the returns a week's sales will eventually generate by that week's sales. A cohort is one week's sales followed to the end. This is the real rate. It is also not knowable on the day, which is why nobody's first report uses it.
Ashmoor measured how long a Coldbeck takes to come back. A shop return arrives the following week, because the customer walks back in. A web return is slower, and Ashmoor's measured spread across the four weeks after despatch is 15%, 45%, 30%, 10%.
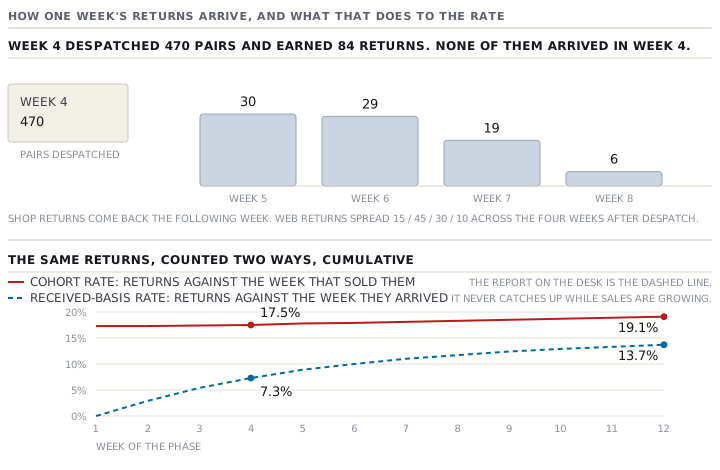
Now watch what that does to the report.
| Week | Gross units | Web share | Returns earned | Returns received | Cumulative received-basis | Cumulative cohort |
|---|---|---|---|---|---|---|
| 1 | 260 | 44% | 45 | 0 | 0.0% | 17.3% |
| 2 | 330 | 45% | 57 | 17 | 2.9% | 17.3% |
| 3 | 400 | 46% | 70 | 36 | 5.4% | 17.4% |
| 4 | 470 | 47% | 84 | 54 | 7.3% | 17.5% |
| 5 | 540 | 49% | 99 | 70 | 8.9% | 17.8% |
| 6 | 590 | 50% | 109 | 82 | 10.0% | 17.9% |
| 7 | 640 | 52% | 121 | 95 | 11.0% | 18.1% |
| 8 | 700 | 53% | 134 | 107 | 11.7% | 18.3% |
| 9 | 760 | 55% | 148 | 119 | 12.4% | 18.5% |
| 10 | 830 | 56% | 164 | 131 | 12.9% | 18.7% |
| 11 | 900 | 58% | 181 | 146 | 13.3% | 18.9% |
| 12 | 980 | 60% | 201 | 160 | 13.7% | 19.1% |
At the end of week 4 the report on Priya's desk said the Coldbeck was running at 7.3% returns. The true rate on the four weeks she had traded was 17.5%. The report was not wrong about anything it counted. It counted 54 received returns against 1,460 gross sales, and both figures were correct. It was reading a top line that had not finished arriving.
And it never catches up inside the phase. At the end of week 12 the received-basis rate reads 13.7% against a cohort rate of 19.1%. It is still more than five points low, because the returns earned in weeks 10, 11 and 12 are mostly still in the post. There are 396 of them. They will arrive in December and be counted against December's sales.
The fix costs nothing and is not a systems project: stamp every return with the week of the ORIGINAL SALE, not the week it was received, and report returns against the week they came from. Every despatch note carries the date. Ashmoor's returns file already held the original order number and was not using it.
The rate moved and nobody touched the product
Look again at the web-share column. It goes from 44% in week 1 to 60% in week 12, which is what a boot does as the weather turns and Black Friday comes closer.
Ashmoor's two measured channel rates for the Coldbeck are 8.0% in shop and 28.9% on the web. Nothing about the boot is different between them. What is different is where the fitting happens. A shop customer tries the boot on before paying, so a return is a change of mind. A web customer's fitting room is their own hallway, so the return is the fitting.
The blended rate is then not a property of the boot at all. It is the weighted average of two fixed rates over a mix that moves every week:
blended rate = shop rate × shop share + web rate × web share
Week 1: 8.0% × 56% + 28.9% × 44% = 17.2%. Week 12: 8.0% × 40% + 28.9% × 60% = 20.5%.
The same arithmetic runs the other way, and it is worth having ready. If the buying team is told to plan next autumn at 65% web, the blended rate becomes 8.0% × 35% + 28.9% × 65% = 21.6%. That is before a single design decision is taken. A channel plan is a returns plan.
The stock row, and what it does to sell-through
Here is the phase in units, with the returns going back where lesson 2 will justify them. Ashmoor grades every return it receives, and 78% of them go back into full-price sellable stock.
| Week | Opening | Intake | Gross sales | Back to stock | Closing |
|---|---|---|---|---|---|
| 1 | 6,000 | 0 | 260 | 0 | 5,740 |
| 2 | 5,740 | 0 | 330 | 13 | 5,423 |
| 3 | 5,423 | 0 | 400 | 28 | 5,051 |
| 4 | 5,051 | 2,400 | 470 | 42 | 7,023 |
| 5 | 7,023 | 0 | 540 | 55 | 6,538 |
| 6 | 6,538 | 0 | 590 | 64 | 6,012 |
| 7 | 6,012 | 0 | 640 | 74 | 5,446 |
| 8 | 5,446 | 1,200 | 700 | 83 | 6,029 |
| 9 | 6,029 | 0 | 760 | 93 | 5,362 |
| 10 | 5,362 | 0 | 830 | 102 | 4,634 |
| 11 | 4,634 | 0 | 900 | 114 | 3,848 |
| 12 | 3,848 | 0 | 980 | 125 | 2,993 |
Take week 4 and check it: 5,051 plus 2,400 less 470 plus 42 is 7,023. Then read down the columns: every closing figure is the next opening figure. The buy was 9,600 pairs, delivered as 6,000 at the start, 2,400 in week 4 and 1,200 in week 8.
Now the two sell-throughs. Both are at week 12, and both are on a buy of 9,600:
- Gross sell-through: 7,400 ÷ 9,600 = 77.1%.
- Net sell-through: (7,400 − 1,413) ÷ 9,600 = 5,987 ÷ 9,600 = 62.4%.
Fifteen points apart, on the same style, in the same week. Both are arithmetically correct. One of them is the number a repeat buy gets sized on. Use the first one and you will buy about a quarter too much of everything. That is a smaller mistake than lesson 3's, and a much easier one to make.
What this lesson does not yet let you say
The 1,017 pairs received back in the phase are not 1,017 pairs of stock. 793 of them went back to full-price sellable stock. The other 224 did something else, at a cost. That is lesson 2.
And the 2,993 pairs closing is a number about a chain, not about a shop. Across the chain the Coldbeck was out of nothing at all on the last day of the phase. It was dead in 36 of Ashmoor's 46 shops. That is lesson 3.
Check yourselfYour web return rate is stable at 30%, your shop rate is stable at 9%, and the blended rate on your monthly report has climbed from 15% to 19% over a season. Product quality is unchanged and no size has been re-graded. What do you look at first, and what would prove it?Show the answer
The channel mix. A blended rate is the weighted average of the channel rates, so it moves whenever the weights move, even if neither rate moves at all. Solve for the web share that produces each figure: 15% needs a web share of about 29%, because 0.09 plus 0.21 times the share equals 0.15; 19% needs about 48%. If your channel mix moved from roughly thirty to roughly fifty percent web over that season — which is what a peak trading period normally does — the blended rate has explained itself, and nothing about the product needs investigating. Report the two channel rates first and the blend underneath, and the question stops arising.
Prompt · Rebuild my return rate so it stops moving
When your returns report shows a rate you do not trust, or a rate that keeps changing while nothing about the product changes.
Act as a retail merchandiser who assumes every returns report is understating until proved otherwise. Here is my data, one row per week: [PASTE - WEEK, GROSS UNITS SOLD, UNITS SOLD IN STORE, UNITS SOLD ONLINE, RETURNS RECEIVED THAT WEEK]. My category is [CATEGORY], the phase runs [NUMBER] weeks from [DATE], my full ticket is [AMOUNT] and my landed cost is [AMOUNT]. Do the following in order. First, work out the received-basis return rate week by week - returns received divided by that week's sales - and say plainly that this is the number my report is showing me. Second, if my file carries the original order or despatch date on each return, rebuild the rate on a COHORT basis: count every return against the week that sold it, and give me both series side by side. If my file does not carry that date, say so first and tell me exactly which field to start capturing. Third, estimate the returns still in transit at the end of my data, using the lag I observe rather than an assumed one, and tell me where my closing rate will settle. Fourth, split the rate by channel and show me the blended rate as the weighted average of the two, then tell me how much of any movement in the blend is explained by mix alone rather than by the product. Fifth, restate my sell-through gross and net, label both, and tell me which one a repeat buy should be sized on. Do not smooth the numbers, do not annualise them, and do not give me a single blended number without the two channel rates above it.
AI can make mistakes — check anything you act on.