Lessons · Lesson 3 of 3
The full door with nothing to sell
Measure a return rate by size, rebuild a buying curve on net sales, and find the door whose rate of sale halved because it was full of stock nobody asked for.
Lesson 3 of 3 · 30 min
The fact that starts the lesson
Not every size comes back at the same rate. The ends of a size run fit worst, so they are sent back most. A till never records that. It records what was bought, not what was kept. This lesson follows the consequence through three steps, and the third is the one to read slowly.
On the last day of the phase the Coldbeck's chain position was 2,993 pairs, and Ashmoor was out of stock in no size anywhere. There were 721 pairs of UK 5 and 780 pairs of UK 6 in the business.
In 36 of the 46 shops the style was dead.
Nobody made a mistake. The buy was signed off on last year's sales. The allocation followed the published curve. The returns bay hit its service level every week of the phase. The replenishment engine ran nightly and did exactly what it was set up to do. This lesson is how four correct decisions produced a style that could not be sold in three-quarters of the shops.
Returns are not spread evenly across a size run, and footwear is the clearest case
Freya Kilvington measured last autumn's Coldbeck by size — 8,000 gross pairs, split 48% shop and 52% web, with the shop rate flat at 8.0% in every size.
| UK size | Gross pairs | Web return rate | Return rate, all channels | Net pairs | Gross curve | Net curve |
|---|---|---|---|---|---|---|
| 3 | 400 | 42% | 25.7% | 297 | 5.00% | 4.58% |
| 4 | 1,200 | 30% | 19.4% | 967 | 15.00% | 14.90% |
| 5 | 2,000 | 24% | 16.3% | 1,674 | 25.00% | 25.79% |
| 6 | 2,160 | 24% | 16.3% | 1,808 | 27.00% | 27.85% |
| 7 | 1,520 | 31% | 20.0% | 1,217 | 19.00% | 18.75% |
| 8 | 720 | 44% | 26.7% | 528 | 9.00% | 8.13% |
| Total | 8,000 | 18.9% | 6,489 |
The shape of that web-rate column is the point, and it is a footwear fact before it is a retail one. A size run is graded from a base size: the last — the wooden or plastic foot shape a shoe is built on — is made once in the middle of the range, and the other sizes are worked out from it by a rule. Grading rules are straight lines. Feet are not. The further a size sits from the base, the more the graded shape differs from the foot it is meant to fit. So the ends of a run fit worst, and the ends of a run come back most. A UK 3 came back at 42% online. A UK 5 came back at 24%.
The curve everybody uses is the wrong one
A size curve is built from sales. The question nobody asks is which sales, and the till only offers one answer.
Read the last two columns of the table. The gross curve — what the till recorded — is 5.00 / 15.00 / 25.00 / 27.00 / 19.00 / 9.00. The net curve, after the returns, is 4.58 / 14.90 / 25.79 / 27.85 / 18.75 / 8.13. Ashmoor publishes it rounded, and it adds up:
| UK size | Gross curve | Net curve | Buy on gross | Buy on net | Difference |
|---|---|---|---|---|---|
| 3 | 5.0% | 4.6% | 480 | 442 | +38 |
| 4 | 15.0% | 14.9% | 1,440 | 1,430 | +10 |
| 5 | 25.0% | 25.8% | 2,400 | 2,477 | −77 |
| 6 | 27.0% | 27.8% | 2,592 | 2,669 | −77 |
| 7 | 19.0% | 18.8% | 1,824 | 1,805 | +19 |
| 8 | 9.0% | 8.1% | 864 | 777 | +87 |
| Total | 100.0% | 100.0% | 9,600 | 9,600 | 0 |
154 pairs too many at the ends and 154 too few in the middle: 1.6% of the buy. Be honest about that number. It is small, it is invisible on any department WSSI — the weekly sheet of sales, stock and intake — and on its own it breaks nothing. It matters because of what happens to it next.
What the returns bay does to the warehouse's shape
Every returned pair goes back into the pool the replenishment engine draws from. So the pool takes on the size profile of the returns, not the size profile of demand.
| UK size | Share of the returns pool | Share of net demand | Ratio |
|---|---|---|---|
| 3 | 6.80% | 4.6% | 1.48 |
| 4 | 15.44% | 14.9% | 1.04 |
| 5 | 21.61% | 25.8% | 0.84 |
| 6 | 23.33% | 27.8% | 0.84 |
| 7 | 20.08% | 18.8% | 1.07 |
| 8 | 12.73% | 8.1% | 1.57 |
A UK 8 is 1.57 times over-represented in what comes back, against what sells. A UK 6 is 0.84. So every week the DC refills itself in a shape that is wider at the ends than the demand it exists to serve — and it does so completely honestly, because it is only putting back what customers sent.
None of this is fatal on its own either. The DC still ends the phase with 604 pairs of UK 5 and 659 of UK 6 sitting on the shelf, which is more than enough to fix every shop in the business twice over. Of the chain's 721 pairs of UK 5 and 780 of UK 6, that leaves 117 and 121 spread across 46 shops — about two and a half pairs of each per door. The units exist. The next section is why they never moved.
Door 12, which the system thought was fine
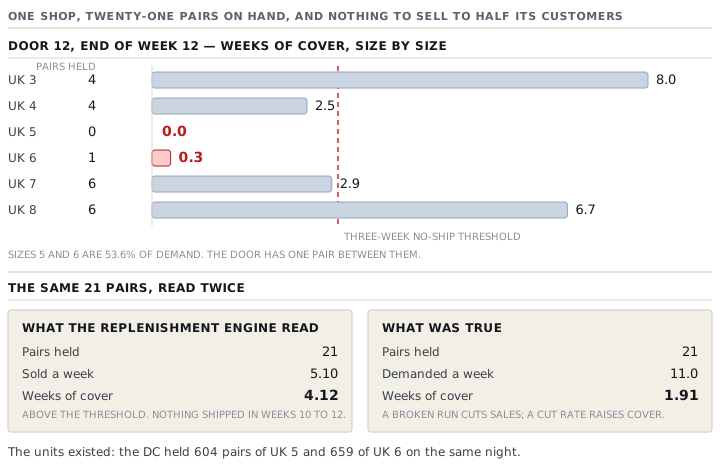
Door 12 is one of Ashmoor's higher-volume shops. It sold 11 net pairs of the Coldbeck a week through the first eight weeks of the phase. This is where it stood at the end of week 12.
| UK size | Pairs held | Weekly net demand | Weeks of cover, this size |
|---|---|---|---|
| 3 | 4 | 0.5 | 8.0 |
| 4 | 4 | 1.6 | 2.5 |
| 5 | 0 | 2.8 | 0.0 |
| 6 | 1 | 3.1 | 0.3 |
| 7 | 6 | 2.1 | 2.9 |
| 8 | 6 | 0.9 | 6.7 |
| Total | 21 | 11.0 |
The door holds 21 pairs and has nothing to sell to more than half the people who walk in. Sizes 5 and 6 are 53.6% of demand, so with those two gone the door can serve 46.4% of it. Its rate of sale therefore falls to 11 × 46.4%, which is 5.10 pairs a week — and that is exactly what the till reported in weeks 11 and 12.
Now read the cover figure — the number of weeks the stock on hand will last — twice.
- On the observed rate of sale, the one every system has: 21 ÷ 5.10 = 4.12 weeks. Comfortable.
- On true demand, which no system has: 21 ÷ 11 = 1.91 weeks. Nearly empty.
Ashmoor's replenishment rule is one line long and looks completely reasonable: top a door up to four weeks' cover on the style, and do not ship where cover already exceeds three weeks. Door 12 read 4.12 weeks. The engine sent nothing. It sent nothing in week 11 as well, and in week 10.
The fix is a line of arithmetic, not a system: read cover on the sizes the door still has.
servable share = the sum of the demand curve over the sizes still in stock
true cover = units held ÷ (rate of sale ÷ servable share)
Door 12: servable share 46.4%, observed rate of sale 5.10, so true demand is 5.10 ÷ 0.464 = 11.0 and true cover is 21 ÷ 11.0 = 1.91 weeks. Ship. Ashmoor now also refuses to call a door "in stock" on a style unless it holds at least one pair in every size covering the core of the curve, which for the Coldbeck is sizes 4 to 7.
The money nobody invoiced
Weeks 7 to 12, as the doors broke one after another. Shop net sales are gross shop sales less the 8.0% shop return rate. The lost demand is the broken doors' share of that, in sizes 5 and 6, less the 35% of customers Ashmoor measured buying a size next to it or ordering to home instead.
| Week | Doors broken | Shop gross | Shop net | Share of shop volume in broken doors | Pairs of demand lost |
|---|---|---|---|---|---|
| 7 | 6 | 307 | 282.44 | 8% | 7.9 |
| 8 | 11 | 329 | 302.68 | 14% | 14.8 |
| 9 | 18 | 342 | 314.64 | 24% | 26.3 |
| 10 | 25 | 365 | 335.80 | 35% | 40.9 |
| 11 | 31 | 378 | 347.76 | 45% | 54.5 |
| 12 | 36 | 392 | 360.64 | 55% | 69.1 |
| Total | 213.5 |
The column adds to 213.5, and here is the rounding rule written down rather than left to the spreadsheet: a part-pair of unmet demand is a customer who walked out, so it rounds up. That is the less flattering direction for this argument, which is why it is stated instead of assumed. It adds GBP 40.63 to the number below.
214 pairs of full-price demand, at a gross margin of GBP 81.27, is GBP 17,391.78.
Then the other end of the same error. Of the 2,993 pairs left at the close, 103 are surplus to the shape of demand — the excess sitting in sizes 3, 4, 7 and 8 above what those sizes will take. They will go to January clearance at GBP 51.60, which is GBP 3.87 of margin instead of GBP 81.27, so GBP 77.40 a pair is given up: GBP 7,972.20.
| Cost | On a report? | |
|---|---|---|
| Processing, write-offs and outlet margin (lesson 2) | GBP 20,830.33 | Yes |
| Full-price demand lost at broken doors | GBP 17,391.78 | No |
| Terminal excess in the end sizes | GBP 7,972.20 | No |
| Total | GBP 46,194.31 | 45.09% of it |
Against the style's gross margin on 5,987 net pairs — GBP 486,563.49 — returns cost 9.49%, and less than half of that appears anywhere a person could read it. The visible half is a processing cost that a good returns bay can shave a few percent off. The invisible half is a size curve and a replenishment rule, and it is fixed with arithmetic that costs nothing at all.
Check yourselfA door holds 30 pairs of a style, is out of the two sizes that make up 40% of demand, and the engine reads 5 weeks of cover on an observed rate of sale of 6 a week. What is the true cover, and what does the door need?Show the answer
The servable share is 60%, so the observed rate of sale of 6 is 60% of true demand: true demand is 6 divided by 0.6, which is 10 a week. True cover is 30 divided by 10, which is 3 weeks, not 5. The door is not comfortable. It is two weeks tighter than it looks. But note what it does NOT need: 30 pairs is plenty of stock in total, so shipping a general top-up would make the problem worse by adding more of the sizes it already cannot sell. What it needs is the two missing sizes and nothing else. That is why the replenishment instruction has to be written per size. And it is why a rule that can only think in total units cannot express the right answer even when somebody notices the problem.
Prompt · Find the doors that are full and dead
When a style's rate of sale is falling in some shops and the stock report says those shops are well stocked.
Act as an allocation analyst hunting for broken size runs, which a total unit count cannot see. Here is my data, one row per store per size: [PASTE - STORE, SIZE, UNITS ON HAND, UNITS SOLD IN THE LAST FOUR WEEKS]. My size curve is [PASTE THE CURVE, OR SAY YOU WILL DERIVE IT], my replenishment rule is [PASTE THE RULE], and my warehouse holds [PASTE STOCK BY SIZE]. Do the following in order. First, tell me whether my size curve was built on gross or on net sales, ask me for the return rate by size if I have it, and warn me plainly that a curve built on gross sales over-weights whichever sizes come back most. Second, for every store, work out the servable share - the sum of my demand curve over the sizes it still holds - and list every store below eighty percent, worst first. Third, for each of those, give me two cover figures: units divided by the observed rate of sale, and units divided by true demand, where true demand is the observed rate divided by the servable share. Tell me which figure my replenishment rule is reading. Fourth, for each broken store name the exact sizes it needs and the quantity, and check them against my warehouse stock by size, so I know whether this is a distribution problem or a buying one. Fifth, estimate the demand lost per week in the broken stores, stating the recapture assumption you used and letting me change it. Never tell me a store is well stocked on a total unit count alone.
AI can make mistakes — check anything you act on.