Lessons · Lesson 2 of 3
Where the scarce counts go
Rank items for counting attention by what being wrong about them costs rather than by what they cost, and know exactly where that ranking stops being trustworthy.
Lesson 2 of 3 · 40 min
Ranking is the decision, not the counting
A store can only count so much. So every counting plan is really a ranking. This item gets looked at often, that one twice a year, and somebody decided which was which. The decision is usually made on annual spend, because spend is the number every system already holds. This lesson asks whether spend is the right axis, and builds the alternative from a store's own records.
Where lesson 1 left the problem
Sambok can release 1,150 hours a year to counting without adding a head. At the measured 9.5 minutes a count, that is about 7,263 counts a year for 1,480 items.
Lesson 1 derived a counting interval from two things: the rate at which records break, and a target for how many items may be wrong at once. It also said, at the end, that the target was the weakest thing in the calculation. It was the same 5% for a roll of shell twill and for a polybag. Shell twill is the outer cloth of the trouser; a polybag is the plastic bag one finished garment goes into. Being wrong about those two things does not cost the same, so holding them to the same exposure spends the scarce counts in the wrong place.
Everything below is about fixing that. The counting arithmetic is unchanged. Only the question of which items get the short interval is on the table.
The usual answer, and where it comes from
Nou Ratanak inherited a plan built on annual issue value, which is what a year's worth of an item is worth. The items carrying most of the money get counted most often. Sambok's stock resolves into ten families that between them hold 512 of the 1,480 items.
| Family | Items | Annual issue value, USD | Rank by value |
|---|---|---|---|
| Shell twill | 62 | 412,000 | 1 |
| Lining taffeta | 38 | 96,500 | 2 |
| Export carton | 24 | 63,200 | 3 |
| Sewing thread | 96 | 47,600 | 4 |
| Trouser zip | 44 | 38,400 | 5 |
| Rivet and shank button | 58 | 24,900 | 6 |
| Fusible interlining | 19 | 21,700 | 7 |
| Polybag | 16 | 17,400 | 8 |
| Woven main label | 71 | 9,300 | 9 |
| Care and size label set | 84 | 6,800 | 10 |
| Total | 512 | 737,800 |
That is the familiar shape. Shell twill alone is 55.8% of the money, and the top three families are 77.5% of it. That is why the value ranking feels so convincing: a small number of items really does carry most of the spend.
The inherited class A, the 220 items counted every four weeks, is exactly the top four of that table: 62 + 38 + 24 + 96 = 220. Nobody at Sambok chose those four families. The value ranking chose them, years ago, and nobody has looked since.
The other axis: what being wrong costs
Value answers the question where is the money. A counting plan exists to answer a different question: what will stop me, or cost me, if the record is wrong. Those are the same question only when every item's error costs the same, which is never true in a garment factory.
So build the other axis from Sambok's own 2027 record. Of the 673 discrepancies the year raised, 118 were consequential, meaning big enough to change something rather than to be absorbed. Each one was priced at what it cost if it was found at the point of use rather than by a count. That figure is called the exposure.
| Family | Consequential errors, 2027 | Cost of a late discovery, USD | Exposure a year, USD | Rank |
|---|---|---|---|---|
| Shell twill | 26 | 1,960 | 50,960 | 1 |
| Trouser zip | 9 | 2,840 | 25,560 | 2 |
| Lining taffeta | 14 | 1,610 | 22,540 | 3 |
| Fusible interlining | 11 | 1,540 | 16,940 | 4 |
| Woven main label | 13 | 720 | 9,360 | 5 |
| Care and size label set | 12 | 410 | 4,920 | 6 |
| Sewing thread | 16 | 190 | 3,040 | 7 |
| Rivet and shank button | 7 | 380 | 2,660 | 8 |
| Export carton | 6 | 130 | 780 | 9 |
| Polybag | 4 | 95 | 380 | 10 |
| Total | 118 | 137,140 |
Read the third column before the fourth. The trouser zip costs more per error than the shell twill does, USD 2,840 against USD 1,960, even though a zip is worth a fraction of a metre of cloth. The reason has nothing to do with the zip's price. The zip is named by Nipigon Outfitters, it is imported, and it is on a 34-day lead time. So a shortfall cannot be covered locally at any price, and the line either waits or the order ships short. The twill can be had from a converter nine days away at a premium.
The cost of an error is set by what you can do about it, not by what the thing is worth. That sentence is the whole of this lesson, and every re-ranking below is a consequence of it.
| Family | Rank by value | Rank by exposure | Move |
|---|---|---|---|
| Shell twill | 1 | 1 | — |
| Lining taffeta | 2 | 3 | down 1 |
| Export carton | 3 | 9 | down 6 |
| Sewing thread | 4 | 7 | down 3 |
| Trouser zip | 5 | 2 | up 3 |
| Rivet and shank button | 6 | 8 | down 2 |
| Fusible interlining | 7 | 4 | up 3 |
| Polybag | 8 | 10 | down 2 |
| Woven main label | 9 | 5 | up 4 |
| Care and size label set | 10 | 6 | up 4 |
Nine of the ten families move, by 2.8 places on average. Only shell twill is in the same place on both lists, and that is exactly why the value ranking survives. The one item everybody would have picked anyway comes first either way, and that is taken as evidence the method works.
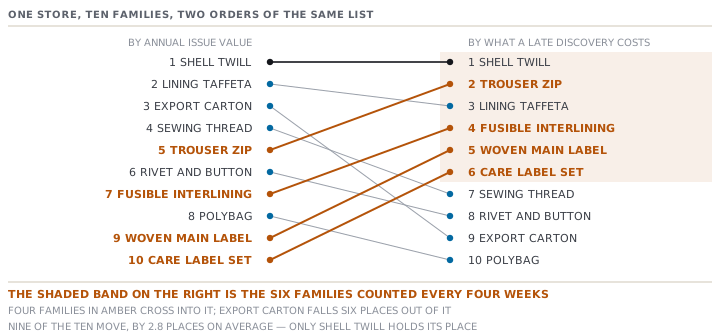
The unit matters, and it is not the family
There is a step here that is easy to skip and changes the answer again. A count is spent on an item, not on a family, and the families are wildly different sizes: 96 thread items against 19 interlinings. Ranking families by total exposure quietly rewards a family for being large.
Divide through.
| Family | Exposure a year, USD | Items | Exposure per item, USD | Rank |
|---|---|---|---|---|
| Fusible interlining | 16,940 | 19 | 891.58 | 1 |
| Shell twill | 50,960 | 62 | 821.94 | 2 |
| Lining taffeta | 22,540 | 38 | 593.16 | 3 |
| Trouser zip | 25,560 | 44 | 580.91 | 4 |
| Woven main label | 9,360 | 71 | 131.83 | 5 |
| Care and size label set | 4,920 | 84 | 58.57 | 6 |
| Rivet and shank button | 2,660 | 58 | 45.86 | 7 |
| Export carton | 780 | 24 | 32.50 | 8 |
| Sewing thread | 3,040 | 96 | 31.67 | 9 |
| Polybag | 380 | 16 | 23.75 | 10 |
Fusible interlining is seventh by value and fourth by family exposure, and it is first per item. Fusible interlining is a stiffening cloth glued onto a panel with a heated press, to hold the shape of a waistband or a pocket flap. It is the cheapest thing on the list that can stop a line: nineteen items, a fusing press that will not run without them, and no substitute that passes a bond test. It is also, at Sambok as at most factories, kept on a shelf nobody signs for.
The two exposure rankings pick the same families for the top of the list and disagree about their order, which is the correct relationship between them. The family total says how much is at stake in a category. The per-item figure says where a count goes.
What it is worth changing
Now the comparison that decides whether any of this was worth doing. Hold the counting hours roughly constant and change only the membership of the four-week band.
inherited class A, by value:      220 items    exposure covered  USD 77,320  = 56.4%
by exposure per item:             234 items    exposure covered  USD 125,360 = 91.4%
                                  14 more items, 182 more counts a year, USD 40.92
The second band is fusible interlining, shell twill, lining taffeta, trouser zip and the woven main label. Those are the first five rows of the per-item table, and they come to 234 items. For USD 40.92 a year of extra counting, the share of Sambok's measured exposure sitting inside the four-week band rises from 56.4% to 91.4%.
Thirty-five points of exposure for forty dollars. That is the finding, and it is not a clever one. It is what happens when a plan that was never questioned is questioned once.
The whole plan, rebuilt
| Band | Counted every | Inherited: items | Inherited: counts | Adopted: items | Adopted: counts |
|---|---|---|---|---|---|
| Close watch | 4 weeks | 220 | 2,860 | 234 | 3,042 |
| Middle | 13 weeks | 430 | 1,720 | 278 | 1,112 |
| Floor | 26 weeks | 830 | 1,660 | 968 | 1,936 |
| Total | 1,480 | 6,240 | 1,480 | 6,090 |
inherited: 6,240 counts = 988.00 h, leaving 162.00 h of the 1,150 in reserve
adopted:   6,090 counts = 964.25 h, leaving 185.75 h in reserve
difference: 150 fewer counts, USD 33.73 less labour a year
The adopted plan is cheaper than the one it replaces and covers 35 points more exposure. It also looks identical from a distance: three bands, the same intervals, the same shape of table. Only the membership changed, and the membership was the entire decision.
One thing it deliberately gives up. Lesson 1's target was that no more than 5% of items in a class should be wrong at any moment, and the bottom band at 26 weeks sits at 5.93%, outside it. The adopted plan accepts that, because the items now in the bottom band are the ones a wrong record costs almost nothing on. A uniform exposure target was the thing this lesson set out to reject, and honouring it here would have undone the argument.
Where the ranking stops being trustworthy
This is the section most rankings do not have, and it is the reason to trust the rest.
The event counts are small
Every exposure figure above is an event count multiplied by a cost. The event counts are single- and double-digit, which means they carry a lot of sampling error. These are counts of rare, independent events, and there is a standard way to put a range around such a count.
| Events observed | Range consistent with the evidence, at ninety-five per cent |
|---|---|
| 26 | 16.98 to 38.09 |
| 14 | 7.65 to 23.49 |
| 13 | 6.92 to 22.23 |
| 12 | 6.20 to 20.96 |
| 11 | 5.49 to 19.68 |
| 9 | 4.12 to 17.08 |
| 7 | 2.81 to 14.42 |
| 6 | 2.20 to 13.06 |
| 4 | 1.09 to 10.24 |
Look at what overlaps. Shell twill's 26 and lining taffeta's 14 have ranges that share everything from 16.98 to 23.49. The first and third families on the exposure list are not separated by their event counts. The four families in the middle, at 11, 12, 13 and 14 events, are one undifferentiated cloud.
Carry that through to the exposure figures themselves, holding the cost of a late discovery fixed:
shell twill  USD 50,960   range 33,281 to 74,656
trouser zip  USD 25,560   range 11,701 to 48,507
polybag      USD    380   range      104 to      973
The zip's range runs from well below the twill's point figure to well above it. What survives is the separation of the top of the list from the bottom. The polybag's entire range sits below every other family's lower bound, and nothing else survives.
So the ranking sorts items into bands. It does not sort them into places. Use it to decide who is in the four-week band and who is in the six-month band. Do not use it to argue that the zip should be counted more often than the lining, because on this evidence you cannot tell.
And the ranges above are too narrow, not too wide. They treat the cost of a late discovery as exact, and lesson 1 showed shell twill's USD 1,960 is the mean of six numbers running from USD 210 to USD 6,840. A range that accounted for both would be wider still.
Most items have no evidence at all
968 of Sambok's 1,480 items produced no consequential error in 2027. Not one. A strict exposure ranking scores every one of them at zero and would never count any of them again.
That is not conservatism. It is a trap that closes on itself. An item that is never counted never produces the discrepancy that would have raised its score, so its score stays at zero because it stays at zero. The evidence and the plan feed each other, and after two years the store is confident about exactly the items it was already confident about.
The floor is the answer, and it is not negotiable. Every item is counted at least twice a year whatever the ranking says, and the floor is costed first, before any band is allocated:
floor:      1,480 items x 2 counts   = 2,960 counts = 468.67 h
close watch:  234 items x 11 more    = 2,574 counts = 407.55 h
middle:       278 items x  2 more    =   556 counts =  88.03 h
                                       6,090 counts = 964.25 h
The floor is 48.6% of the counting the store does. It buys almost nothing on the evidence available, and it is the part of the plan that finds the thing the evidence could not have predicted.
The evidence is a year old and the order book has moved
The 2027 events are about 2027's styles. Sambok's 2028 book moves NP-3306 onto a nylon shell with a different zip supplier, and the interlining changes with it. Re-derive the ranking every year, and treat the first year of any new material as unranked. That is precisely what the floor is for.
And the cost column is not innocent either
The cost of a late discovery was priced from what actually happened. So it is measured only for items that have gone wrong at Sambok, and it is measured under Sambok's own recovery options: a converter nine days away, an air freight lane it already uses. Change either and the column changes. This is the number a reader must not copy. It is a measurement to take on your own operation, and there is no shortcut to taking it.
Check yourselfA store has no record of what a late discovery has cost it, because nothing has ever been priced. It has two years of discrepancy counts by item. What can it build, and what must it not pretend?Show the answer
It can build half of the ranking honestly. The event counts give the frequency axis, and the corrected rate from lesson 1 turns them into arrivals per item-year. That alone is worth having, because it separates items that go wrong often from items that go wrong rarely, and that separation is already better than spend. What it cannot do is multiply, because the cost axis is missing. The temptation is to fill it with something plausible, such as the item's unit price or its lead time in days. Both are wrong in the same way. They are properties of the item rather than measurements of a consequence, and a ranking built on them will look exactly as authoritative as one built on evidence. The honest move is to start pricing the next ones. Every consequential shortage from today is one row: what was short, when it was found, what was actually spent to recover, and what waited. Twenty rows is a poor measurement, and it is not nothing, and it beats a number that was invented because a column had to be filled.
Check yourselfMeas Vibol argues that the four-week band should be decided by him, because he knows which materials stop his cutting room, and that a year-old table of events is a worse guide than his judgement. How much of that is right?Show the answer
More than a merchandiser usually wants to admit. His judgement is the only source for two things the table cannot hold. The first is a material that has not gone wrong yet but would be catastrophic if it did, which the evidence scores at zero. A buyer-named trim on a first order is the example. The second is the ordering inside a band, which the confidence ranges show the evidence cannot settle. When shell twill and lining taffeta cannot be told apart statistically, somebody who knows which one has no substitute should break the tie. What his judgement is not good for is the thing it feels most confident about, which is relative frequency. People remember the shortage that stopped a line and forget the ninety that were caught quietly. So a judgement-built list over-weights the memorable and under-weights the routine. The exposure table exists precisely because the twelve care-label errors nobody remembers add up to more than one dramatic one. The workable split is that the evidence sets the bands and he sets the order within them. Anything he wants moved up a band gets moved and gets written down, so that next year there is evidence about it.
Prompt · Rank my items by what being wrong about them costs
When the counting plan came from annual spend and nobody has asked since, and any time a cheap item stops a line.
Help me decide where my scarce counting attention goes, and then tell me where the answer stops being trustworthy.

Ask me for two lists. The first is my items grouped into families, with the number of items in each and the annual issue value of each. That is the ranking I probably already have. The second is harder, and it is the one that matters. For each family, ask how many times in the last year a discrepancy in it was consequential, meaning it changed something rather than being absorbed, and what each of those events actually cost when it was found at the point of use rather than by a count. Ask me to price those from real events, and if I have never priced one, tell me to start now rather than letting me estimate.

Then build both rankings. Rank the families by annual issue value. Rank them by consequential events multiplied by the cost of a late discovery. Show me the two orders side by side, with the rank movement of each family. Then divide the exposure by the number of items in the family and rank a third time, because a count is spent on an item and not on a family, and tell me which families change place when you do.

Then make it a decision. Hold my counting hours roughly constant, tell me which families should be in the short-interval band under each ranking, and give me the share of my total measured exposure that each choice covers. Give me the difference in counts a year and in money.

Then do the part I did not ask for. Give me a confidence range for each event count, treating them as counts of rare events, and tell me plainly which families are genuinely separated by the evidence and which are indistinguishable. Say explicitly that the ranking sorts items into bands rather than into places, and refuse to argue for one family over another when their ranges overlap.

Finally, three refusals. Refuse to score an item at zero just because it has no events yet, and insist on a floor frequency that every item gets whatever the ranking says. Refuse to fill my cost column with unit price or lead time as a stand-in for a consequence I have not measured. And tell me that the ranking is about last year's styles, so it has to be re-derived every year, and a new material is unranked until it has a history.
AI can make mistakes — check anything you act on.