Lessons · Lesson 1 of 3
How often is often enough
Measure how fast a store's records break, from its own count history, and derive a counting interval from that rate instead of from a habit.
Lesson 1 of 3 · 40 min
What a count is actually for
Everybody agrees a store should be counted. Almost nobody can say how often. Two answers are usual. One is once a year, because that is when the auditor comes. The other is a slice of the store every day. Both are habits, not decisions. This lesson turns the question into one your own records can answer. What does a count buy you, and how fast does a store stop being right?
The factory, the order, the basis
Sambok Apparel makes woven trousers and outerwear in Takhmao, Kandal Province, Cambodia. It employs 1,150 people across eight sewing lines. Its stores hold 1,480 active stock items: fabric, trim, packaging and finished goods. Everything in this course happens inside them.
Five people appear.
- Chan Sopheak runs the stores.
- Nou Ratanak is the inventory controller. The counting plan is his.
- Meas Vibol runs the cutting room. He is the store's most impatient customer.
- Prak Sokunthea is the financial controller. She decides who may change a stock figure.
- Ouk Bunthoeun is the plant manager.
The order carried through all three lessons is NG-4409, for Nipigon Outfitters, a Canadian mid-market outdoor-clothing chain. The style is NP-3306, a men's cotton-nylon work trouser, 62,000 units.
Say the basis once, because every figure below depends on it. All money is US dollars, which is what Cambodia quotes and what Sambok buys in. Fully loaded store labour is USD 1.42 an hour. Fully loaded means the wage plus social charges plus a share of supervision. The figure comes from Sambok's own 2027 payroll, not from a country average. Supervisory and controller time is USD 2.90. Sunday work is paid at twice the weekday rate, so USD 2.84 and USD 5.80. Every duration below was timed at Sambok, on Sambok's own stock. Every consequence was priced from an event that really happened there.
Counting does not make a store accurate
Start with the thing that is almost always assumed and is not true. Counting does not prevent a single error. Every mistake this store will make this year will be made whether or not anybody counts. A pick that nobody recorded. A putaway to the wrong bay, a putaway being the act of placing goods into a storage place. A roll issued in metres and booked in rolls.
What a count does is discover. Because it discovers, the real product of a counting regime is not accuracy. It is the age of an error when you find it.
That sounds like a distinction without a difference. It is the whole subject, and here is why. An error found while the pallet, the paperwork and the person who moved it are all still in the building can be explained. An explanation is what stops the next one. The same error found eleven months later is a number in a column. Nothing can be done with it except adjust it away.
So the question "how often should we count?" is really the question "how old are we willing to let an error get?" That one can be answered with arithmetic.
Two regimes, costed at Sambok
Sambok runs both, as most factories do.
The annual full count. The store is frozen and everything in it is counted at one moment. Sambok holds it on a Sunday, so no production is lost. That is worth noticing, because it removes the largest line most factories carry.
| Cost | Basis | USD |
|---|---|---|
| Counting labour | 34 people, 9.5 hours, at the Sunday rate of USD 2.84 | 917.32 |
| Supervision and reconciliation | 4 people, 16.0 hours, at USD 5.80 | 371.20 |
| Investigation and recount the following week | measured 96.0 hours at USD 1.42 | 136.32 |
| Total | 1,424.84 |
Cycle counting. A slice of the store is counted every working day, forever. How often an item comes round is set by its class. Sambok inherited a plan built on annual issue value, which is what a year's worth of the item is worth.
| Class | Items | Counted every | Counts a year |
|---|---|---|---|
| A | 220 | 4 weeks | 2,860 |
| B | 430 | 13 weeks | 1,720 |
| C | 830 | 26 weeks | 1,660 |
| Total | 1,480 | 6,240 |
6,240 counts x 9.5 min measured a count = 59,280 min = 988.00 h
988.00 h x USD 1.42                                  = USD 1,402.96
investigation, 673 discrepancies x 19 min = 213.12 h = USD   302.63
                                               total = USD 1,705.59
Now put the two side by side, and notice what happens.
annual full count = USD 1,424.84
cycle counting    = USD 1,705.59
Cycle counting at Sambok costs USD 280.75 a year more than the full count it is supposed to replace. That is the opposite of the way the comparison is usually presented, and the reason is not subtle. The usual comparison charges the full count with a lost production day, and Sambok does not lose one. Take the production day out, and a full count is a cheap way to touch every item once.
So on cost alone, cycle counting loses. That tells you cost alone is the wrong comparison, because the two regimes are not buying the same thing. The full count buys a position at one moment, once a year. Cycle counting buys the age of an error. Until that is priced, nothing has been compared at all.
Measuring how fast the store breaks
To price the age of an error you first need the rate at which errors arrive. Most stores believe this cannot be measured. It can, and Sambok's inherited plan handed it the experiment by accident: three groups of items, counted at three different intervals, for a whole year.
A discrepancy is a difference between what is on the shelf and what the record says.
| Class | Items | Interval | Counts | Discrepancies | Per count | Naive rate, per item-year |
|---|---|---|---|---|---|---|
| A | 220 | 4 weeks | 2,860 | 268 | 0.09371 | 1.2182 |
| B | 430 | 13 weeks | 1,720 | 214 | 0.12442 | 0.4977 |
| C | 830 | 26 weeks | 1,660 | 191 | 0.11506 | 0.2301 |
| Total | 1,480 | 6,240 | 673 |
The last column is the obvious calculation, discrepancies divided by items. It is wrong in a direction nobody notices.
Why a long interval understates its own error rate
A count does not report how many errors happened on an item. It reports whether the item is wrong now. Two errors on the same item between two counts show up as one discrepancy. If they point in opposite directions, they can show up as none.
So the longer the interval, the more errors each count hides inside itself. Treat errors as arriving independently, at a rate written as the Greek letter lambda per item-year. A count at interval T then finds a discrepancy whenever at least one error has arrived:
share of counts that find a discrepancy = 1 - e^(-lambda x T)
therefore lambda = -ln(1 - share) / T
Run Sambok's three classes through it. T is in years, so 4 weeks is 0.076923 and 26 weeks is 0.5.
| Class | Share of counts finding a discrepancy | Naive rate | Corrected rate | Understated by |
|---|---|---|---|---|
| A | 0.09371 | 1.2182 | 1.2791 | 5.0% |
| B | 0.12442 | 0.4977 | 0.5315 | 6.8% |
| C | 0.11506 | 0.2301 | 0.2445 | 6.3% |
class A: -ln(1 - 0.09371) = 0.098396, / 0.076923 = 1.2791 per item-year
class B: -ln(1 - 0.12442) = 0.132869, / 0.250000 = 0.5315 per item-year
class C: -ln(1 - 0.11506) = 0.122235, / 0.500000 = 0.2445 per item-year
Five to seven per cent is a smaller correction than it looks as though it should be. That is worth saying plainly, because an honest report of a correction includes the times it does not matter. At these intervals it changes no decision Sambok makes. It is worth knowing anyway, for one reason.
Push the interval out to a year and the same arithmetic stops being a footnote:
a class A item breaking at 1.2791 a year, counted once a year:
  share of counts finding a discrepancy = 1 - e^(-1.2791) = 0.7217
  so the annual count sees 0.7217 where 1.2791 arrive
  understated by 1 - 0.7217 / 1.2791 = 43.6%
A store that counts a fast-breaking item once a year understates its own error rate by nearly half. This is the second thing the annual count quietly does, and it is worse than the first. It does not only find errors late. It reports a store as more accurate than the store is, using the store's own data, honestly gathered. Nobody is doing anything wrong. The measuring instrument simply cannot see two errors that cancelled.
Deriving the interval
Now the arithmetic that answers the question. Errors arrive through the interval, and a count clears them. So at a moment chosen at random, an item has been carrying an undetected error for somewhere between nothing and the whole interval, and on average half of it.
expected undetected errors per item at a random moment = lambda x T / 2
share of items wrong at a random moment                = 1 - e^(-lambda x T / 2)
Sambok's class A, at the four weeks it already counts:
1.2791 x 0.076923 / 2 = 0.049196
1 - e^(-0.049196)     = 0.0480, so 4.80% of class A items are wrong right now
Turn it round. Nou Ratanak's board carries a target he can defend to Ouk Bunthoeun: no more than one class A item in twenty wrong at any moment. One in twenty is 5%, so:
required lambda x T / 2 <= -ln(0.95) = 0.051293
class A: T <= 2 x 0.051293 / 1.2791 = 0.080202 years = 4.17 weeks
class B: T <= 2 x 0.051293 / 0.5315 = 0.193014 years = 10.04 weeks
class C: T <= 2 x 0.051293 / 0.2445 = 0.419577 years = 21.82 weeks| Class | Counted every | The target implies | Share wrong at a random moment, as run |
|---|---|---|---|
| A | 4 weeks | 4.17 weeks | 4.80% |
| B | 13 weeks | 10.04 weeks | 6.43% |
| C | 26 weeks | 21.82 weeks | 5.93% |
Three things fall out of that table, and only one of them is the obvious one.
Class A is right, and it is right by accident. Four weeks is the number every cycle-counting article gives for an A item. At Sambok it happens to land 0.17 of a week inside the target. Five weeks would not. Five weeks gives 5.96% wrong at any moment, which is outside the target. The rule of thumb was correct here. It would not have been correct at a store breaking twice as fast, and nothing in the rule of thumb tells you which store you are in.
Classes B and C are counted too seldom by Sambok's own standard. Rounded to whole weeks, the target puts B on 10 weeks, where 4.98% are wrong at a random moment, and C on 21 weeks, where 4.82% are. That is 911 more counts a year and USD 204.82 of labour. It is a genuinely small number, and the first honest argument for cycle counting that has appeared in this lesson. It also brings the whole plan to 7,151 counts and 1,132.24 hours, which is inside Sambok's counting capacity by eighteen hours and not by much more.
And the target itself is the weakest part of the whole calculation. It is the same 5% for a fabric roll and for a polybag, and that cannot be right, because being wrong about those two things does not cost the same. The interval arithmetic is sound. The input it is fed is a guess with a reason. Lesson 2 replaces it.
Pricing the age of an error
One family, followed properly, because this is where the money is.
Sambok's shell twill family is 62 stock items. Shell twill is the outer cloth of NP-3306, in its colours and weights. It went to the cutting room 620 times in 2027, which is 10.0 issues an item a year. It produced 26 consequential shortages, meaning differences big enough to threaten a cut rather than to be absorbed.
Of the 26, 20 were found by a count and 6 were found at the cutting table, with Meas Vibol standing over them.
| Found by | Events | What happened | Mean cost, USD |
|---|---|---|---|
| A cycle count | 20 | The buy was brought forward. No premium, no stoppage | 84.00 |
| The cutting table | 6 | Local converter at nine days, air freight, or a line stood down | 1,960.00 |
The six are worth printing in full. A mean of six numbers is a fragile thing to build on, and hiding it inside an average is how a course becomes untrustworthy:
210.00   340.00   520.00   980.00   2,870.00   6,840.00
mean 1,960.00        median 750.00
One event is 3.5 times the mean and 9.1 times the median. Every figure downstream of USD 1,960.00 inherits that, and there is a sensitivity check at the end of this section for exactly that reason.
Which one finds it first
An error arrives somewhere inside the interval. After that, two things are racing: the next count, and the next issue to cutting that runs short. Sambok issues shell twill 10.0 times an item a year. So between an error arriving and the next count there are on average 10.0 x T / 2 issues, and each of them reveals the shortfall with some probability p.
Do not guess p. Sambok's own split gives it. At the four-week interval, 6 of the 26 were found at the cutting table:
P(found at the cut) = 6 / 26 = 0.230769
expected issues before the next count = 10.0 x 0.076923 / 2 = 0.384615
(1 - p)^0.384615 = 1 - 0.230769 = 0.769231
ln(0.769231) = -0.262364, divided by 0.384615 = -0.682146
1 - p = e^(-0.682146) = 0.505531, so p = 0.4945
Just under half of the issues on an item carrying a real shortfall reveal it. The rest do not. The shortfall may be smaller than the roll being drawn, or the cutter may take from a different roll.
That gives one constant, 10.0 / 2 x 0.682146 = 3.410730 a year, and from it the whole curve:
P(found at the cut, at interval T) = 1 - e^(-3.410730 x T)
cost of one shortage = 84.00 + P x (1,960.00 - 84.00)| Interval | Found at the cut | Cost of one shortage, USD | Shortages a year | Expected cost a year, USD | Counting labour, USD | Total, USD |
|---|---|---|---|---|---|---|
| 2 weeks | 12.29% | 314.64 | 27.3 | 8,589.67 | 362.43 | 8,952.10 |
| 4 weeks | 23.08% | 516.92 | 27.3 | 14,111.92 | 181.21 | 14,293.13 |
| 8 weeks | 40.83% | 849.94 | 27.3 | 23,203.36 | 90.61 | 23,293.97 |
| 13 weeks | 57.37% | 1,160.32 | 27.3 | 31,676.74 | 55.76 | 31,732.50 |
| 26 weeks | 81.83% | 1,619.12 | 27.3 | 44,201.98 | 27.88 | 44,229.86 |
| 52 weeks | 96.70% | 1,898.06 | 27.3 | 51,817.04 | 13.94 | 51,830.98 |
The 27.3 is the 26 observed shortages, corrected by the same 5.0% the class A masking correction gave. A shortage that cancelled another one inside an interval was never seen either. The counting labour column is 62 items at the interval shown, at 9.5 minutes each and USD 1.42 an hour. The percentages are rounded for reading and the money is not. Each cost is computed from the unrounded probability, so reproducing a cent needs the exponential rather than the printed percentage.
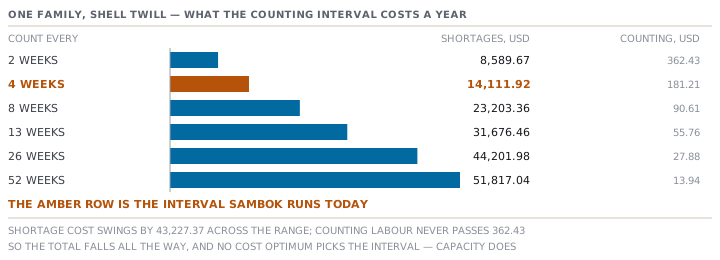
The arithmetic gives an answer that cannot be right
Look down the total column. It falls all the way, with no turning point anywhere a store would recognise. Differentiate it properly and there is a minimum. Here it is:
counting cost   = 62 x USD 0.224833 / T      (T in years)
shortage cost   = 27.3 x [84 + 1,876 x (1 - e^(-3.410730 T))]
setting the derivatives equal gives T = 0.00908 years = 0.47 of a week
Every shell twill item, counted about twice a week. That is 6,860 counts a year on 62 items, and 1,086.17 hours of counting. Sambok's entire counting capacity is 1,150 hours, being the inventory controller's year less his other duties. The arithmetic has just proposed spending 94.4% of the whole store's counting capacity on 62 of its 1,480 items.
Follow the arithmetic until it stops being sensible, then say where it stopped. Three things are missing from the model, and each of them bites hardest at exactly the short intervals it recommends.
A count has its own error rate. Of the 673 discrepancies raised in 2027, 71 disappeared on supervised recount: the count was wrong and the stock was right. That is 1.14% of the 6,240 counts. Count twice a week and a rising share of what you find is your own noise. In money it is small. Some 6,860 counts would raise about 78 false discrepancies a year at 19 minutes each, or USD 35.07. But the cost that matters is not the money. It is that a store which raises noise stops being believed, and the value of that is unknown.
The mean of six is doing more work than six numbers can bear. Re-run the whole curve with the median of those six, USD 750.00, in place of the mean, and the optimum moves from 0.47 of a week to 0.80 of a week. The recommended interval rises by 70% on one choice about six numbers. Both choices are defensible. Neither is a measurement of anything, with six observations behind it.
And the binding constraint is not cost at all. At USD 1.42 an hour a count costs USD 0.22, and a shortage found at a cutting table costs USD 1,960.00. Nothing about that ratio produces a sensible answer in between. It just says count more, forever. What actually limits Sambok is the 1,150 hours, and those hours are a headcount decision made once a year, not a marginal cost that trades against anything.
So the real question is not the one this lesson set out to answer. It is not how often should we count. It is where do the counts we can afford go. That question cannot be answered by an error rate, because it is a question about consequence.
Check yourselfA second factory measures its class A discrepancy rate at 0.42 per item-year on a 13-week interval and concludes it is four times as accurate as Sambok. What is wrong with the comparison, and what is the corrected rate?Show the answer
Two things are wrong. The first is arithmetic. A rate of 0.42 on a 13-week interval is a naive rate that hides the errors that cancelled. The share of counts finding a discrepancy is 0.42 divided by 4 counts a year, so 0.105. The corrected rate is minus the natural log of 0.895 divided by 0.25, which is 0.4437 per item-year rather than 0.42. That is about 5.6% higher, the same order of correction Sambok's classes showed. The second thing is worse, and it is not arithmetic at all. Sambok's 1.2791 and this factory's 0.4437 are rates of a thing each store defines for itself. A discrepancy is a difference big enough that somebody wrote it down, and the threshold below which nobody bothers is a local habit. Unless both stores raise a discrepancy at the same size of difference, the two numbers are not comparable, and the ratio between them measures their paperwork rather than their stock. The useful comparison is a store against its own previous year, on an unchanged threshold.
Check yourselfOuk Bunthoeun reads the total column and asks why Sambok does not simply count everything weekly, since counting is so cheap compared with a stoppage. Answer him with this lesson's own numbers.Show the answer
Because the column he is reading is one family. Sambok's whole counting capacity is 1,150 hours a year, and a count takes 9.5 minutes, so the store can perform about 7,263 counts a year in total. Counting all 1,480 items weekly is 76,960 counts, which is 12,185 hours, or roughly ten more people. The total column falls forever because it prices counting at labour only, and never runs into the capacity that actually exists. So it answers the question "is one more count worth its wage" rather than "where does the next count go". Only the second question is the one Sambok faces. The honest version of his instinct is right, though, and it should be said back to him. At these numbers the marginal count is worth far more than it costs, so the argument for adding a counting head is strong. The correct next step is to price that head against the exposure it would cover, rather than to squeeze the existing plan.
Prompt · Derive my counting interval from my own error rate
Before setting or defending a cycle-count frequency, and any time somebody quotes four weeks for an A item as though it were a law.
Help me work out how often my store should count each class of item, using only my own count history.

First ask me for: my item count by class, the interval each class is currently counted at, the number of counts performed in the last full year, the number of discrepancies those counts raised, how many of those discrepancies disappeared on recount, the time one count takes, and my fully loaded store labour rate.

Then compute the error-arrival rate properly. Do not divide discrepancies by items and stop. Two errors on one item between two counts show up as one discrepancy, or as none, so correct for it. The share of counts finding a discrepancy equals one minus the exponential of minus the rate times the interval in years. So the rate is minus the natural log of one minus that share, divided by the interval. Show me the naive rate and the corrected rate side by side, and tell me by what percentage the naive one understated. Then run the same correction at a one-year interval, and tell me how much an annual count would understate my error rate, so I can see what my own audit count is hiding.

Then ask me for a target I am willing to defend, phrased as the share of items in a class that may be wrong at any one moment. Derive the interval that holds each class to it. The share wrong at a random moment is one minus the exponential of minus the rate times the interval divided by two. Give me the required interval in weeks, rounded to whole weeks, and the share wrong at the interval I run today.

Then cost it, and cost the alternative: my annual full count, with the counting labour, the supervision, the investigation afterwards and the production it stops. Tell me whether the stopped production is a loss of contribution or only an overtime premium, because that depends on my order book and not on the count.

Three rules. Do not quote me any industry figure for an error rate or for a counting frequency; every input must come from my records. If my counting capacity in hours is smaller than the plan you derive, say so and stop, rather than presenting a plan I cannot run. And where the arithmetic gives an interval so short it is obviously unworkable, tell me that plainly, and tell me which cost the model has left out, rather than presenting the answer as a recommendation.
AI can make mistakes — check anything you act on.