Lessons · Lesson 1 of 6
- 01 · What a sewing machine actually reports
- 02 · Three layers, and what each one is for
- 03 · Retrofitting: the sensor decides the question you can ask
- 04 · Downtime, and the reason a machine cannot give you
- 05 · The integration nobody budgets: one bundle, five names
- 06 · The count that drifts, and the hour a week that catches it
What a sewing machine actually reports
Take a piece count apart into the signal that was measured and the assumptions that turned it into a number, and say which of them can be wrong.
Lesson 1 of 6 · 20 min
The situation
14 March, Sumilon Garments, Mandaue. Six weeks into the sensor programme, Rowena Sabandal is standing at machine 214 with two numbers that cannot both be true.
The screen at the end of line 4 says machine 214 produced 418 sweatshirt bodies on yesterday's shift. The output box beside the machine, counted by hand at the bell, held 372.
Nobody has done anything wrong. The sensor worked all day. The operator did her job. The arithmetic in the system is arithmetic anybody would have written. And the number on the screen is 12.6% higher than the number in the box.
This lesson is about where those 46.7 pieces came from, because the answer is the whole subject of the course.
What the sensor emits
Machine 214 is a five-thread safety-stitch overlock. It runs operation 40 on style FL-318: close the side seam and set the sleeve in one pass. On its handwheel there is a magnet. Beside the handwheel there is a pickup, a small sensor that closes an electrical contact once every time the wheel turns.
That is the entire signal. A pulse, and the time it arrived.
The pickup does not know:
- what garment is under the needle, or whether there is one
- which operation, which order, which colour, which size
- who is sitting at the machine
- whether the seam that was just sewn is any good
- whether the machine is stopped because the operator went for water or because the thread broke
Everything on the screen above is built out of pulses and times by arithmetic somebody wrote. That includes pieces, efficiency, downtime and the operator's earnings. The pulse is a measurement. The piece count is an argument.
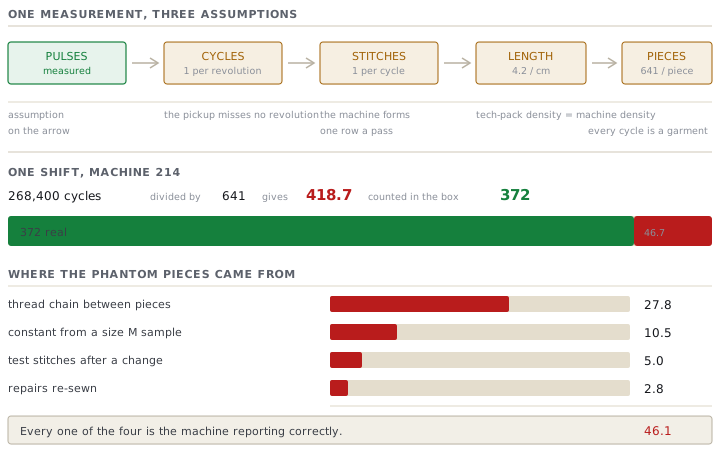
The chain, arrow by arrow
| Step | What it does | What it assumes |
|---|---|---|
| Pulse to machine cycle | Counts contact closures | The magnet passes once a revolution and the pickup misses none |
| Cycle to stitch | Treats a cycle as a stitch | The machine forms one stitch a cycle — true here, false on a machine that forms two rows in one pass |
| Stitch to seam length | Divides by stitch density | The density set in the tech pack is the density on the machine today |
| Seam length to pieces | Divides by length per piece | Every cycle logged belongs to a garment that will be shipped |
Only the top row is a measurement. The other three are claims about the world. Each one is somebody's decision that nobody wrote down.
The last one is the dangerous one, and Sumilon's system makes it. Operation 40's sewn length on the approved size M sample is 152.6 cm. At the specified 4.2 stitches a centimetre that is 640.92 cycles. The system rounds it to a constant of 641 cycles a garment. Machine 214 logged 268,400 cycles. Divide, and you get 418.7 pieces.
Where the 46.7 pieces came from
Rowena spent a morning at the machine with a stopwatch, a tape and a counter. Four things account for the gap, and every one of them is the machine reporting correctly.
| Where the cycles went | Phantom pieces | Share of the real count |
|---|---|---|
| Thread chain run off between pieces, measured at 11.4 cm a garment | 27.8 | 7.5% |
| The constant came from a size M sample; the order's weighted sewn length is 156.9 cm | 10.5 | 2.8% |
| Test stitches after a thread change, a needle change or a mechanic's adjustment | 5.0 | 1.3% |
| Repairs re-sewn on the same machine, at 2.8% of pieces and 41 cm a repair | 2.8 | 0.8% |
Those add to 46.1 pieces. The remaining 0.6 was the garment still under the needle when the bell went.
Look at the largest one. A safety-stitch machine cannot start a seam without a chain of loose stitching. A good operator runs that chain off cleanly at the end of every piece. The chain is 11.4 cm of stitching a garment. That is 7.5% of the day's cycles, spent doing the operation properly. The system counted it as sewing, because it is sewing. It simply is not a garment.
Look at the second. The constant was taken from the sample the tech pack was approved on, which is a size M. The order runs up to XXL, and the size mix pulls the average sewn length to 156.9 cm. A constant that is 2.8% short does not make the count 2.8% short. It makes it 2.8% long, because the constant is what you divide by. A merchandiser who works this out in their head usually gets the direction wrong.
Why nothing on the screen contradicts anything else
The uncomfortable part is that the inflated count is not an isolated error. It is the input to everything.
Line efficiency is earned minutes divided by attended minutes. Earned minutes are pieces times the standard minute, which is the time the operation was costed at. So line 4's efficiency is 12.6% overstated on this operation. Work in progress is what was issued to the floor minus what was completed, so it is understated by the same pieces. If operators are paid on output, the payroll is wrong. The order's cumulative production, which the merchandiser reports to the buyer, is wrong.
And all of it is internally consistent. Efficiency agrees with output because it was computed from output. Work in progress agrees with production because it was computed from production. Nothing on any screen disagrees with anything on any other screen. That is exactly why a factory can run a whole season on numbers that are wrong.
That is the finding this course is built on. Lesson 6 prices it on the FL-318 order.
Check yourselfThe system's constant for an operation is 641 cycles a garment. You discover the real average is 712. Does the reported piece count go up or down when you correct it?Show the answer
Down. Pieces are cycles divided by the constant, so raising the constant lowers the count. Correcting 641 to 711.7 takes machine 214's shift from 418 reported to 377 — against 372 counted, an error of 1.4% instead of 12.6%. The correction is unpopular precisely because it makes every historical number smaller.
What to do about it, today
You do not need a better sensor. You need the chain written down.
- For every number the system reports, write the arrow diagram: what was measured, and what each step assumes.
- Name the person who owns each assumption. The stitch density belongs to the technical department. The length per piece belongs to industrial engineering. The decision to count the chain as sewing belongs to nobody, which is why it is wrong.
- Re-derive every constant from the production garment in the size mix actually running, not from the sample.
- Subtract what is measurable and not a garment — chain, test stitches, repairs — rather than pretending it does not exist.
- Compare the result against a hand count. Lesson 6 is about how often, and why an hour a week is enough.
Prompt · Take one reported number apart into signal and assumption
Before you believe any number a machine-data system reports, and the first time a system's figure disagrees with something you counted by hand.
Act as an industrial engineer who has spent years reconciling machine-data output against hand counts in garment factories, and who assumes nothing. I want ONE reported number taken apart. Facts: factory [NAME], style [STYLE], operation [NUMBER AND DESCRIPTION], machine class and stitch type [DESCRIBE], sensor fitted [DESCRIBE EXACTLY WHERE IT IS AND WHAT IT DETECTS], the number the system reports [PASTE IT WITH ITS UNITS AND PERIOD], and the constant or formula the system uses if you know it [PASTE IT]. Also give me: sewn length per garment and the size it was measured on, the order's size ratio, stitch density specified, thread chain length run off per piece if measured, repair rate and average repair length, and anything a mechanic or operator does that makes the machine run without producing a garment. Do the following. First, write the inference chain from the raw signal to the reported number as a numbered list of steps, and beside each step state what it ASSUMES, in one sentence, in plain language. Second, mark each step as MEASURED or ASSUMED, and say which single assumption the number is most sensitive to. Third, quantify every source of cycles or events that is not a shipped garment, in the same units as the reported number, and give me a total. Fourth, tell me the direction of each error, meaning whether it makes the reported number too high or too low, and warn me clearly wherever an error in what you divide by flips that direction against intuition. Fifth, give me a corrected constant and re-state the reported number using it. Sixth, name the person or department who should own each assumption, and flag any assumption that currently belongs to nobody. Do not give me a range where a number is possible, ask me for any input you need rather than assuming it, and list every assumption you made at the end.
AI can make mistakes — check anything you act on.
What belongs to other lessons
The other half of shop-floor data is the part a person enters: a bundle scanned, an operation confirmed, a reason typed at a terminal. That is course 24.1's subject, and most of the real difficulty lives in how that capture is designed. Course 24.3 owns what happens after: the screen, the report, the number a manager is shown. This course sits between them, on the machines themselves.