Lessons · Lesson 1 of 3
The grid that has to balance
Build a WSSI that balances every week in units and in money, write the same week at cost and watch a row vanish, and read weeks of cover for what it really says.
Lesson 1 of 3 · 50 min
The situation
A shop that sells clothes asks one question every Monday morning. How much stock do we own, and is it more than we should own? The sheet that answers it has five rows, repeated week by week. This lesson builds one from nothing. It shows that the five rows are one piece of bookkeeping, not five separate numbers. Stock comes in only as deliveries. It goes out only as sales. The one other way the number moves is when somebody cuts the price of what is already there.
Monday 5 October 2026, a first-floor office above the Bristol shop. Penhallow is a British outdoor and athleisure retailer: 88 shops across the United Kingdom and Ireland, and a website that sells more than any three of them. The department is Men's Knitwear, Autumn/Winter 26 — crew necks, half-zips, merino mid-layers, everything worn between a shirt and a coat.
The phase runs 20 weeks, from the week starting 24 August 2026 to the week starting 4 January 2027. Yesterday closed week 6.
Two people look at the same sheet. Rosalind Marner is the merchandiser. She owns the money, the timing, the intake and the markdown. Cormac Straiton is the buyer. He owns the product. On the supply side of the very same order, merchandiser means the person who runs it through a factory, which is course 7.1's subject. Two jobs, one word. Say which chair you are sitting in the first time it matters. This course sits in Rosalind's.
The sheet is a WSSI — Weekly Sales, Stock and Intake. It is the control sheet a department uses during the season, and it is the most-used document in retail planning. British, Irish, Australian and South African teams call it that. American teams more often say merchandise financial planning, and talk about open-to-buy. Same thing, different words.
Five rows, and they are not five independent numbers
A WSSI holds, for each week and each department:
- Opening stock — what you owned on Monday morning.
- Intake — what arrived at the warehouse and was booked in.
- Sales — what went through the tills and the website.
- Markdown — the value taken off price tickets, whether or not anything sold.
- Closing stock — what you owned on Sunday night.
One identity ties them together, and the whole discipline hangs off it:
closing stock = opening stock + intake − sales − markdown
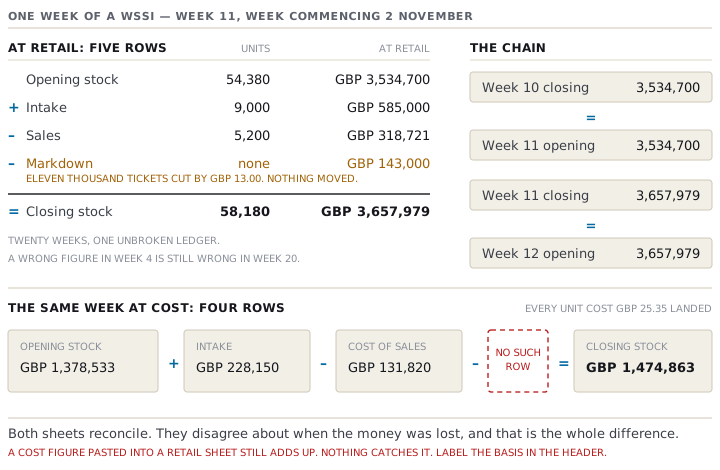
Nobody chose that rule. It is what the words mean. Nothing enters stock except intake. Nothing leaves except a sale. The only other way the number can move is if you change the price of what is sitting there. There is a second identity underneath it, and people forget to write it down: this week's closing stock is next week's opening stock. The grid is a chain, not twenty separate columns. That is why one wrong figure in week 4 is still wrong in week 20.
Say the basis once, then never again
Half the confusion in retail arithmetic comes from a basis nobody stated. Penhallow keeps its WSSI at retail. Stock is valued at the price ticket on it today. Sales are recorded at the price actually taken. When a ticket is cut, the stock row loses value that day, whether or not a single garment moves.
The other option is to keep the sheet at cost. The two sheets answer different questions, and they will disagree about the same week. Here is Penhallow's real week 6, written both ways, so you can see how far apart they are.
Penhallow buys this department at a blended 61.0% intake margin. Intake margin is the share of the ticket price that is not cost. So a GBP 65.00 ticket cost GBP 25.35 to land. (Real margins differ line by line. A department plan uses the blended rate and says so.)
| Row | At retail | At cost |
|---|---|---|
| Opening stock | GBP 2,278,900 | GBP 888,771 |
| Intake | GBP 409,500 | GBP 159,705 |
| Sales | GBP 200,200 | GBP 78,078 |
| Markdown | GBP 0 | — |
| Closing stock | GBP 2,488,200 | GBP 970,398 |
Both balance. Now look at the markdown row. At cost it does not exist. A garment that cost GBP 25.35 still costs GBP 25.35 after you cut its ticket. Marking down changes nothing on a cost sheet until the goods actually sell, and then it shows up as a lower selling price rather than as an event.
That one missing row is the whole argument. A retail-basis WSSI tells you the moment you lose the money. A cost-basis WSSI tells you the moment you hand over the garment. Both are correct. A department that half-uses each is not.
The first six weeks, as planned
This is the plan Rosalind phased in June, in units and at retail. The cover column is explained further down.
| Week | Opening units | Opening GBP | Intake units | Intake GBP | Sales units | Sales GBP | Markdown GBP | Closing units | Closing GBP | Cover |
|---|---|---|---|---|---|---|---|---|---|---|
| 1 | 21,000 | 1,365,000 | 1,500 | 97,500 | 1,300 | 84,500 | 0 | 21,200 | 1,378,000 | 9.0 |
| 2 | 21,200 | 1,378,000 | 5,100 | 331,500 | 1,700 | 110,500 | 0 | 24,600 | 1,599,000 | 8.8 |
| 3 | 24,600 | 1,599,000 | 5,500 | 357,500 | 2,100 | 136,500 | 0 | 28,000 | 1,820,000 | 8.6 |
| 4 | 28,000 | 1,820,000 | 5,700 | 370,500 | 2,600 | 169,000 | 0 | 31,100 | 2,021,500 | 8.4 |
| 5 | 31,100 | 2,021,500 | 5,900 | 383,500 | 3,000 | 195,000 | 0 | 34,000 | 2,210,000 | 8.2 |
| 6 | 34,000 | 2,210,000 | 6,300 | 409,500 | 3,500 | 227,500 | 0 | 36,800 | 2,392,000 | 8.0 |
Take any row and check it. Week 4: 1,820,000 plus 370,500 minus 169,000 minus nothing is 2,021,500. Then read the two stock columns down the page: week 4's closing is week 5's opening, to the pound. Do that once by hand on your own sheet. A WSSI that does not balance is not a slightly untidy WSSI. It is a different document that happens to have the same headings.
The markdown column is empty for six weeks because the plan takes no markdown until week 15. That is normal for a knitwear phase. It is also why these first weeks are the wrong place to learn that row, so we will come back to it.
The same six weeks, as they happened
| Week | Opening units | Opening GBP | Intake units | Intake GBP | Sales units | Sales GBP | Markdown GBP | Closing units | Closing GBP | Cover |
|---|---|---|---|---|---|---|---|---|---|---|
| 1 | 21,000 | 1,365,000 | 1,500 | 97,500 | 1,210 | 78,650 | 0 | 21,290 | 1,383,850 | 9.1 |
| 2 | 21,290 | 1,383,850 | 5,100 | 331,500 | 1,560 | 101,400 | 0 | 24,830 | 1,613,950 | 8.9 |
| 3 | 24,830 | 1,613,950 | 5,500 | 357,500 | 1,900 | 123,500 | 0 | 28,430 | 1,847,950 | 8.7 |
| 4 | 28,430 | 1,847,950 | 5,700 | 370,500 | 2,320 | 150,800 | 0 | 31,810 | 2,067,650 | 8.6 |
| 5 | 31,810 | 2,067,650 | 5,900 | 383,500 | 2,650 | 172,250 | 0 | 35,060 | 2,278,900 | 8.4 |
| 6 | 35,060 | 2,278,900 | 6,300 | 409,500 | 3,080 | 200,200 | 0 | 38,280 | 2,488,200 | 8.3 |
Nothing here looks like a crisis. Week 1 sold 90 units fewer than plan. Across 88 shops and a website, that is one garment per shop per fortnight. Noise. Intake arrived exactly on schedule every week, because it was ordered in March and the ships arrived. Nobody took a markdown, because there was nothing to mark down in September.
Now put the two grids side by side and read what the arithmetic says rather than what the eye says.
| Plan | Actual | Difference | |
|---|---|---|---|
| Cumulative sales | GBP 923,000 | GBP 826,800 | GBP 96,200 short |
| Cumulative intake | GBP 1,950,000 | GBP 1,950,000 | none |
| Closing stock, units | 36,800 | 38,280 | 1,480 over |
| Closing stock, at retail | GBP 2,392,000 | GBP 2,488,200 | GBP 96,200 over |
The stock is over by exactly the amount the sales are short. That is not a coincidence and it is not luck. Intake was identical and markdown was zero on both sides, so the identity leaves nowhere else for the difference to go. Every pound of sales you miss becomes a pound of stock you own, at retail, immediately.
Sit with that for a moment. It is the sentence a factory-side reader has never had to think about. On the supply side, a missed sale is a missed sale. In a retailer, a missed sale is turned into stock by an accounting identity. That stock then needs weeks, space and eventually a markdown to clear. The loss does not arrive later. It arrives the same Sunday, in a different row.
What the markdown row actually does
Skip forward to see the row working. In week 11, the week starting 2 November, Rosalind cut 20% off 11,000 units of early-autumn lightweights — from GBP 65.00 to GBP 52.00.
| Row | Units | At retail |
|---|---|---|
| Opening stock | 54,380 | GBP 3,534,700 |
| Intake | 9,000 | GBP 585,000 |
| Sales | 5,200 | GBP 318,721 |
| Markdown | 0 | GBP 143,000 |
| Closing stock | 58,180 | GBP 3,657,979 |
The markdown row carries no units. Eleven thousand tickets moved by GBP 13.00 each, which is GBP 143,000, and not one garment left the building. The stock row fell by that much on the spot. The sales row is the mixed week that follows. Of the 5,200 units sold, 1,483 went at the new GBP 52.00 and 3,717 at the full GBP 65.00. That is why GBP 318,721 is not a round number, and it should not be.
Three weeks later, on Black Friday, the same row does it at scale. Cutting 18,000 units from GBP 65.00 to GBP 48.75 is GBP 292,500. And 7,050 units from the November group stepped down a second time to GBP 45.50, for another GBP 45,825. That is GBP 338,325 of stock value gone in a single Friday, with the units still on the rail.
Cover, and the reason it is read wrong
The sixth number on the sheet is worked out rather than recorded:
weeks of cover = closing stock units ÷ average forecast weekly unit sales for the weeks ahead
Cover answers one question. At the rate we expect to sell, how many weeks would this stock last? Penhallow's convention is the next four weeks' forecast. For the last four weeks of the phase it uses the spring knitwear rate of 3,000 units a week, because knitwear at an outdoor retailer does not stop in January. Any convention will do. Not writing it down will not.
At the end of week 6 Penhallow held 38,280 units, against a forecast averaging 4,600 units a week for weeks 7 to 10. So cover is 8.3 weeks against a plan of 8.0.
Two things about that number, and they are the two things everybody gets wrong.
Cover looks forward, so the same figure means opposite things at different points in a season. At the end of week 6, with 14 weeks of the phase left, 8.3 weeks of cover is comfortable. You have not yet bought the December peak. At the end of week 18, with two weeks left, Penhallow held 7.1 weeks of cover. That is not a slightly worse version of the same thing. It says the stock in the building cannot be sold inside the season at any price short of clearance. Always say the week.
Cover is a ratio, and the number you divide by is a forecast. Divide by a forecast you no longer believe and you get a reassuring answer with nothing behind it. Course 17.3 owns how a forecast is built and rebased. Here it is enough to know that the figure in the cover column is only as honest as the row you divided by, and lesson 3 shows exactly what that costs.
What this sheet cannot tell you
Three limits, stated now so the next two lessons are not read as more than they are.
- A WSSI is a department, not a product. It sets a sold-out half-zip against a dead cardigan and reports the average. Which lines to repeat and which to kill is course 16.5's subject, and no amount of staring at this grid will produce it.
- Stock is not one number. Owned, in transit, on order, allocated to a shop but not yet arrived, in a broken size run, in returns processing — a retailer's stock figure is a different number in each system. This sheet holds one of them: what the warehouse and the shops own and have booked in.
- It is a control, not a forecast. The grid tells you where you are against a plan. It does not tell you where you will end up, and lesson 3 is about the one line somebody has to add to make it do that.
Check yourselfYour department's WSSI balances perfectly, sales are 4% behind plan, and closing stock at retail is bang on plan. What must be true?Show the answer
Something else moved to absorb the miss, because the identity does not let the stock sit still while sales are short. Either intake came in under plan by roughly the same amount — a delayed delivery, which will land next week and put you straight back over. Or a markdown was taken, which cut the value of the stock without shifting any units. That flatters the stock row while making the season worse. Check the units column. If closing stock at retail is on plan but closing stock in units is over, the markdown did it, and you are looking at a devalued overstock rather than a healthy one.
Prompt · Make my WSSI balance, and tell me which basis it is on
When you have inherited a weekly sales, stock and intake sheet, and you are not sure it adds up or which basis it is kept on.
Act as a senior retail merchandiser who has been handed somebody else's WSSI and trusts nothing on it. Here is my sheet, one row per week: [PASTE - WEEK, OPENING STOCK, INTAKE, SALES, MARKDOWN, CLOSING STOCK, AND UNITS IF I HAVE THEM]. My department is [DEPARTMENT]. The phase runs [NUMBER] weeks from [DATE]. I have [NUMBER] shops plus [ONLINE OR NOT]. My blended intake margin is [PERCENT] and my average full ticket is [AMOUNT]. Do the following, in order. First, test the identity on every single week: closing stock must equal opening plus intake, less sales, less markdown. List every week that fails, with the size of the break. Do not tell me the sheet is broadly fine. Second, test the chain: each week's closing must equal the next week's opening, to the penny. Third, tell me which basis the sheet is on, at retail or at cost, and say what evidence in the numbers you used to decide. If the markdown row is filled in, it cannot be at cost. If the stock value divided by the units is near my cost price, it cannot be at retail. If you find both bases mixed in one sheet, say so first and stop. Fourth, add a forward cover column using the next four weeks of my forecast, state the convention you used in one line, and flag any week where cover is rising while sales are falling. Fifth, tell me what is missing that a control sheet needs, and put intake on order at the head of that list if it is absent. Do not smooth the numbers. Do not round to make a break disappear. And do not tell me a sheet balances until you have checked every row.
AI can make mistakes — check anything you act on.