Lessons · Lesson 2 of 3
The migration nobody got wrong
One move off spreadsheets, three data faults that every check passed, and what they cost a coats department.
Lesson 2 of 3 · 40 min
What was signed off
A business moves its planning off spreadsheets and into a system. The usual proof that the move worked is that the old and new totals agree. This lesson shows why that proof is worthless. A grand total does not move, no matter how much you shuffle underneath it. So a check at the top can pass while every figure beneath it has moved. This lesson follows one such move through three faults that all survived a clean sign-off.
Merrowby's planning system went live for Autumn/Winter 26. The migration had a sign-off test. It was a sensible one, and it passed.
The test was: does last year's Outerwear sales value in the new system tie to the finance ledger?
| Spreadsheet | New system | Difference | |
|---|---|---|---|
| Womenswear Outerwear | GBP 20,920,000 | GBP 20,920,000 | GBP 0 |
It tied to the penny. Devraj Pattani printed it, Nuala Farrimond signed it, and the project moved to go-live.
By week 20 of the season the department was GBP 508,440.00 of gross profit short of the plan. Gross profit is what is left of the selling price after the cost of the garment. Three faults caused it, and this reconciliation could not have seen any of them. Not unlikely to see. Incapable.
Fault one: a class that moved to a new parent, and the profile that came with it
The decision, which was right
Padded outerwear had been growing at Merrowby for four seasons. It sat in two places: a Padded subclass inside Coats, and a Puffer subclass inside Jackets. Because a padded coat is a coat and a padded jacket is a jacket. Between them they were 27.0% of the department last year, and they were reviewed by two different people who never met.
So for Autumn/Winter 26 Merrowby created a Padded class of its own, pulling both subclasses out of their old parents. One buyer, one plan, one review. Nobody would argue with it. It is the merchandising decision the growth demanded.
What it did to last year
| Subclass | Sales | Old parent | New parent |
|---|---|---|---|
| Wool | GBP 6,240,000 | Coats | Coats |
| Rainwear | GBP 2,640,000 | Coats | Coats |
| Padded | GBP 3,760,000 | Coats | Padded |
| Puffer | GBP 1,890,000 | Jackets | Padded |
| Tailored | GBP 2,980,000 | Jackets | Jackets |
| Casual | GBP 3,410,000 | Jackets | Jackets |
| Class | Old hierarchy | New hierarchy | Change |
|---|---|---|---|
| Coats | GBP 12,640,000 | GBP 8,880,000 | −29.7% |
| Padded | — | GBP 5,650,000 | new |
| Jackets | GBP 8,280,000 | GBP 6,390,000 | −22.8% |
| Department | GBP 20,920,000 | GBP 20,920,000 | 0.0% |
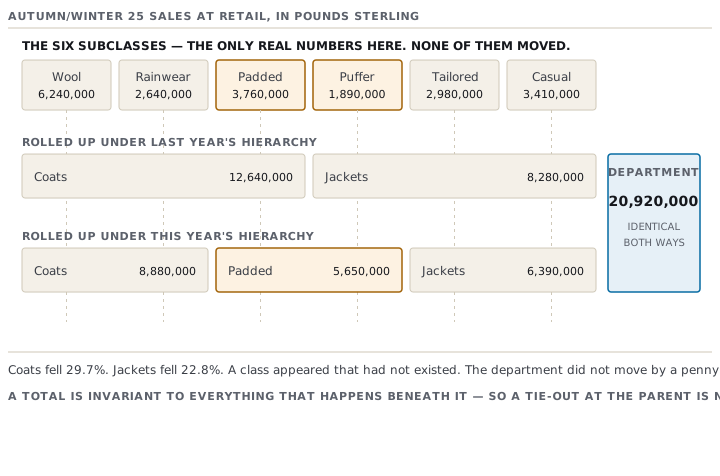
Look at the bottom row, then at the two above it. Every single class in the department changed, one of them by nearly a third, and the total did not move by a penny. It could not have. Moving a class to a new parent moves money sideways between children. The parent is the sum of its children, so it does not care how they are grouped.
That is not a coincidence to be noted. It is what a total is, and it means:
The part that actually cost money
The class totals in the new system were, in fact, correct. The load applied the new hierarchy to the history, and Coats came across as GBP 8,880,000, which is the true restated figure. Nobody was misled by a wrong number.
They were misled by a profile.
The season file had a tab called Coats seasonality. It said what share of the class's intake should land in each of the twenty-six weeks, and it had been maintained by hand over eight seasons. It was migrated as the Coats class's phasing profile, unchanged, because it looked like a setting.
It was data. It had been worked out under the old definition of Coats, which included padded coats. Padded outerwear sells later and harder in the cold weeks. Wool and rainwear peak earlier, rainwear earliest of all. So the profile Merrowby carried into the new system described a class that no longer existed, and it was late.
| Share of intake | Units | |
|---|---|---|
| The profile the class should have had | 26.0% | 21,840 |
| The profile that was migrated | 18.0% | 15,120 |
| Shortfall | 6,720 |
Full-price demand in those six weeks was 19,400 units. 15,120 arrived. 4,280 units of demand met an empty rail. Merrowby tracked what happened to them. 2,650 customers bought the coat later in the season, by which time it was at 25.0% off. 1,630 did not come back.
The class sells at a full price of GBP 128.00 against a cost of GBP 44.00, so:
gross profit at full price   128.00 − 44.00        = GBP 84.00
gross profit at 25.0% off     96.00 − 44.00        = GBP 52.00
1,630 lost outright        1,630 × 84.00           = GBP 136,920.00
2,650 sold 32.00 cheaper   2,650 × 32.00           = GBP  84,800.00
                                                     ───────────────
                                                     GBP 221,720.00
One thing is not in that number. The 6,720 units that arrived late still arrived, and most of them were still there at the end of the season. Merrowby costed the demand it could prove and left the leftover-stock half out. That is why this figure is a floor rather than an estimate.
Fault two: a store with no open date
The Trenholme shop opened in week 19 of Autumn/Winter 25. It traded eight weeks of that season and all of this one.
The store list was migrated with name, region and grade. There was no column for an opening date, because the season file had never needed one. Nuala Farrimond simply knew. The system's field existed and was left empty, which it read as "always open".
That one blank field produced two separate failures.
The reported growth that was not growth
| Sales | |
|---|---|
| Last year, weeks 1 to 13 | GBP 3,552,000 |
| This year, weeks 1 to 13 | GBP 3,640,800 |
| Reported like-for-like | +2.5% |
| Of which the Trenholme shop | GBP 88,800 |
| Comparable estate, this year | GBP 3,552,000 |
| True like-for-like | 0.0% |
Like-for-like means comparing only the shops that traded in both years. The comparable estate was flat. Every penny of the reported growth was one new door, counted against a last year in which it did not exist. A like-for-like figure is a promise that the two sides contain the same shops. A store with no open date breaks that promise silently, and the number it produces looks exactly like the number it should have produced.
Merrowby did not cost this one, because the plan it fed had not yet been committed when the error was found. It is in the lesson and not in the total, deliberately.
The allocation that starved the shop
The second failure did cost money. The allocation engine builds each store's share from its average weekly sales last year. With no open date, it worked out Trenholme's average over the whole season:
true weekly rate       GBP 62,400 ÷  8 weeks = GBP 7,800
computed weekly rate   GBP 62,400 ÷ 26 weeks = GBP 2,400
The engine saw 30.8% of the shop it was allocating to. Trenholme was stocked as though it were a third of its actual size, and it ran out of sizes in week 3.
Replenishment recovered part of it, which is what replenishment is for. It could not recover the weeks the sizes were missing. Merrowby measured demand of 1,440 units against 800 sold: 640 units of unmet demand. Those coats existed. They were in other shops, in the wrong shops, and they eventually sold at an average 35.0% off:
gross profit at full price      128.00 − 44.00 = GBP 84.00
gross profit at 35.0% off        83.20 − 44.00 = GBP 39.20
640 units × 44.80 forgone                      = GBP 28,672.00
That is the careful reading. Merrowby could have costed the 640 as lost sales at GBP 84.00 each and reported GBP 53,760.00. It chose the reading it could prove: the units did sell, later and cheaper, somewhere else.
Fault three: a size curve held one level too high
The season file held a size curve per subclass, per store grade. A size curve is the share of a buy that goes into each size. The new system holds size profiles at class, chain by default. The migration loaded the curves at the default level, because that is what a default is for, and nobody had been asked which level Merrowby needed.
Coats is two subclasses that are not worn the same way. A wool coat goes over a jacket and runs large. Rainwear is worn over a shirt and runs small.
| Size | Wool | Rainwear | Blend used |
|---|---|---|---|
| 8 | 8.0% | 13.0% | 10.5% |
| 10 | 17.0% | 22.0% | 19.5% |
| 12 | 25.0% | 27.0% | 26.0% |
| 14 | 24.0% | 20.0% | 22.0% |
| 16 | 16.0% | 12.0% | 14.0% |
| 18 | 10.0% | 6.0% | 8.0% |
The two subclasses were bought at the same quantity this season, 42,000 units each. That is what makes the blend exactly the midpoint and the arithmetic below easy to read.
| Size | Wool, correct | Wool, as bought | Wool difference | Rainwear, correct | Rainwear, as bought | Rainwear difference |
|---|---|---|---|---|---|---|
| 8 | 3,360 | 4,410 | +1,050 | 5,460 | 4,410 | −1,050 |
| 10 | 7,140 | 8,190 | +1,050 | 9,240 | 8,190 | −1,050 |
| 12 | 10,500 | 10,920 | +420 | 11,340 | 10,920 | −420 |
| 14 | 10,080 | 9,240 | −840 | 8,400 | 9,240 | +840 |
| 16 | 6,720 | 5,880 | −840 | 5,040 | 5,880 | +840 |
| 18 | 4,200 | 3,360 | −840 | 2,520 | 3,360 | +840 |
5,040 coats, 6.0% of the buy, were made in a size the customer for that subclass does not buy. They sat until the sizes around them were gone, and cleared at 40.0% off:
gross profit at full price      128.00 − 44.00 = GBP 84.00
gross profit at 40.0% off        76.80 − 44.00 = GBP 32.80
5,040 units × 51.20 forgone                    = GBP 258,048.00
The shortfall in the other sizes is the same 5,040 coats seen from the other end, so it is counted once. And this is only the product half of the error. The curve was also flattened from grade to chain, so a grade-A shop in a city got the same size mix as a grade-C shop in a market town. Merrowby could not separate that effect from this one and left it out. The largest of the three faults is the one whose cost is most understated.
The bill
| Fault | Units affected | Cost |
|---|---|---|
| A phasing profile worked out under the old hierarchy | 4,280 | GBP 221,720.00 |
| A store with no open date | 640 | GBP 28,672.00 |
| A size curve held at class and chain | 5,040 | GBP 258,048.00 |
| Total | GBP 508,440.00 |
The Coats plan was 84,000 units and GBP 9,240,000 of sales at achieved prices, at a planned achieved margin of 60.0%. So the bill is 9.2% of the class's planned gross profit, or GBP 6.05 on every coat in the buy.
Two honesty notes, both Nuala Farrimond's, both on the paper she took to the board.
- The total is an upper bound, not a floor. Each fault was costed on its own against the correct data. A coat that was both in the wrong size and in the wrong week is counted once in each line. So the three overlap somewhere and the true figure is a little lower. Adding them is the honest thing to do only if you say this.
- Two of the four costs are missing entirely. The leftover stock from fault one and the grade half of fault three. Both are real. The number is not precise. It is the right size, which is all a number needs to be to change a decision.
Nobody got it wrong
This is the part worth taking away, and it is not a comfort.
- Creating a Padded class was correct. Padded outerwear had earned its own buyer.
- Opening the Trenholme shop was correct. It is trading ahead of its plan.
- Loading the size curves at the system's default level was defensible. It is the level most retailers hold them at, and nobody on the project was asked whether Merrowby was most retailers.
- The sign-off reconciliation was the right test to run, competently run, and it passed.
There was no bad decision, no missed deadline, no crashed screen and no vendor to blame. Every failure came from the same place. A mapping changed, and the numbers that had been worked out under the old mapping came across as though they were facts rather than opinions. A class total is a fact. A phasing profile, a store share and a size curve are opinions about history, and they expire the moment the history is restated.
Check yourselfYour migration's reconciliation pack ties at department level, at class level and at subclass level, all to the penny, for the whole of last year. What can still be wrong?Show the answer
Everything that is not a sales total. The tie-outs prove the sales measure adds up correctly under the current hierarchy. They say nothing about whether that hierarchy was the one in force last year. And they say nothing at all about the derived data: phasing profiles, size curves, store shares, store open and close dates, grade assignments, the calendar alignment. At Merrowby all three faults would have survived a perfect three-level tie-out, because none of them was a wrong total. Reconcile the totals, then reconcile the profiles separately, and ask of each one which hierarchy it was worked out under.
Prompt · Hunt for the three faults in my own migration
Before a planning-system go-live, or the first time a season's numbers disagree with a spreadsheet that was right last year.
Act as a retail planning data auditor. I am moving my planning off spreadsheets, or I have already moved and something is wrong. Find the faults that a tie-out at the top cannot see, and cost the ones you find. Here is what I can give you. My product hierarchy today: [PASTE IT]. My product hierarchy as it was last season, if it differs: [PASTE IT, OR SAY UNCHANGED, OR SAY I DO NOT KNOW]. Any class or subclass created, merged, split or moved to a new parent in the last two seasons: [LIST THEM WITH DATES]. My store list with region, grade, opening date and any closure or refit period: [PASTE - AND TELL ME PLAINLY IF THE OPENING DATE COLUMN IS EMPTY]. Every profile in use, with the level it is held at and the date it was last worked out: [SIZE CURVES, STORE SHARES, PHASING OR SEASONALITY, FORECAST PROFILES]. My reconciliation pack from the migration: [WHAT LEVEL DID IT TIE AT]. Class economics for the category in question: full price [AMOUNT], cost [AMOUNT], planned achieved price [AMOUNT], buy quantity [UNITS], and the markdown depths I actually take [PERCENTAGES]. Do the following. First, for every hierarchy change, show me last season rolled up BOTH ways, old parentage and new, and tell me which totals are unchanged and which children moved. Say plainly that a parent being unchanged proves nothing. Second, list every profile that was worked out before a hierarchy change and used after it, because each one is now describing a group that no longer exists. Third, for every store with a missing, blank or default opening date, tell me what that does to like-for-like and what it does to an allocation share built from average weekly sales, and give me both wrong numbers and both right ones. Fourth, check whether any size curve is held at a level above the level at which my subclasses genuinely differ, and if so blend the curves to show me the units that land in the wrong size. Fifth, cost each fault: units affected, the margin forgone per unit at the markdown depth those units actually clear at, and a total. State plainly whether your total is an upper bound because the faults overlap. Sixth, list what you could NOT cost and why. Show every calculation. Where I have not given you a number, ask; do not substitute a benchmark.
AI can make mistakes — check anything you act on.