Lessons · Lesson 1 of 3
Three hierarchies, one grain
What every planning system is underneath, and why the level a number is stored at decides what you can ever ask of it.
Lesson 1 of 3 · 40 min
The situation
Every piece of planning software is the same three things underneath. Ways to slice the business up. Numbers stored against those slices. Rules for moving a number between levels. This lesson describes all three in plain words. Then it spends most of its length on one question: how much detail is a number actually kept at. You can always throw detail away. You can never get it back.
6 April 2026, a head office above a warehouse in the west midlands of England. Merrowby is a womenswear chain built on outerwear: 96 shops across Britain and a website that trades as its 97th location. The department is Womenswear Outerwear. That means coats, jackets, everything worn over everything else. It is the largest department in the business. The planning manager is Nuala Farrimond. The merchandise systems lead is Devraj Pattani.
For eleven years Outerwear has been planned in one spreadsheet. Everyone calls it the season file. In September it moves into a planning system.
This course is not about which system. It is about the thing the spreadsheet and the system have in common. That is the only part of the move that can really go wrong, and almost nobody in the building can describe it today.
Every planning system is the same three things
Underneath the sales demonstration, whoever wrote it and whatever it is called, a retail planning system is:
- Some dimensions: the hierarchies you slice by. In retail there are always three, and only three. Product, location and time.
- Some measures: numbers stored against a combination of those. Sales, units, intake, markdown, stock, margin.
- Some rules for moving a number between the levels of a dimension.
That is the model. The screens, the workflow, the approvals, the alerts, the optimiser and the artificial intelligence all sit on top of those three. None of them can be better than what is underneath. Get the three right and you will get further with a spreadsheet than most people get with software. Get them wrong and no amount of the rest will save the season.
So the question that matters when you look at a system is never what can it do. It is what does it store, at what level, and what happens when that level changes.
The product hierarchy
A product hierarchy is a strict tree. Every member has exactly one parent. That is what makes the totals add up.
| Level | What it is | Merrowby's Outerwear |
|---|---|---|
| Division | The trading business | Womenswear |
| Department | Where a buyer and a planner are paired | Outerwear |
| Class | What a customer would call a kind of thing | Coats, Padded, Jackets |
| Subclass | What a buyer plans and reviews | Wool, Rainwear, Padded, Puffer, Tailored, Casual |
| Option | A style in a colour, the thing that is bought | 214 in Autumn/Winter 26 |
| SKU | A style in a colour in a size, the thing that is sold | 1,284 |
SKU is short for stock keeping unit. It is the smallest thing a till can scan.
Two things about that table are worth more than they look.
"Exactly one parent" is a hard requirement, not a preference. If a garment can sit in two classes, you do not have a hierarchy. You have a tagging scheme. A report at class level will count the same garment twice, and no total will ever tie. Tags are useful and Merrowby has plenty of them, such as sustainable fibre, transitional weight and online exclusive. But tags live beside the hierarchy, never inside it.
The style number is not the hierarchy. Merrowby's wool coats have always carried an MW- prefix and its rainwear an MX-. That is a habit, not a structure, and lesson 2 turns on the difference. When a class moves to a new parent, a code built around the old structure has one of two fates. Either it is reissued on live styles, which breaks every historic report, every supplier's records and every label. Or it is allowed to lie. Let it lie. The code is a name tag. The hierarchy is a table.
The location hierarchy
| Level | Members | Note |
|---|---|---|
| Chain | Merrowby | — |
| Country | Britain | One member today |
| Region | North, Midlands, South, Scotland, Online | Five |
| Grade | A, B, C | Volume bands, reset each spring |
| Store | 96 shops and the website | 97 locations |
A level with one member looks like waste. It is not. The day Merrowby opens in Ireland, a country level that already exists costs nothing. A country level that has to be inserted means restating every historic report, so the new tree can be compared to the old one. Levels are cheap to keep and expensive to add.
The website is modelled as its own region, rather than as a shop inside the South. That decision has consequences either way. Inside the South it would distort every average that region produces, because it is several times the size of any shop in it. As its own region it is honestly separate. But now no regional total includes it. So anybody comparing "the estate" to "the chain" is comparing two different things and needs to be told which they have.
A store is not just a name and a region. It needs three dates: when it opened, when it closed, and every period it was shut for a refit. Nothing in a planning system is more boring than those fields. Nothing in lesson 2 costs more.
The time hierarchy
Merrowby trades on a 4-5-4 calendar. That is the published retail calendar. It divides the year into months of four, five and four weeks. Each month then holds the same number of weekends year on year, which is what makes a fair comparison possible at all. A 53rd week is added every few years to keep the calendar tied to the real date.
| Level | Safe to compare year on year? | Why |
|---|---|---|
| Year | Yes, except across a 53-week year | The extra week has to be named and removed |
| Season | Yes | Autumn/Winter is 26 weeks in both years |
| Month | Only against the same month | A 4-5-4 month is four weeks or five, so a step from one month to the next means nothing unless you know which |
| Week | Yes | The only level whose shape never changes |
| Day | Yes, by day of week | Trading is a weekday pattern before it is anything else |
There is a second trap in time, and it is not about the calendar. Three different weeks can be attached to the same coat: the week it was ordered, the week it was received, and the week it was sold. A sales plan lives in the third. An intake plan lives in the second. An open-to-buy commitment lives in the first. Open-to-buy is the money you still have free to spend on stock for a period. The despatch advice, which is the message a supplier sends to say what has actually shipped, is what tells the warehouse and therefore the planning system which week the intake really lands in. It is called EDI 856 in the X12 message standard and DESADV in EDIFACT. When it is wrong, intake moves weeks and the open-to-buy moves with it.
Grain
Here is the idea the whole course rests on.
The grain of a measure is the single combination of levels at which one number is stored: one level from each hierarchy, and nothing finer.
Every number in a planning system has a grain, including the ones nobody thinks of as numbers.
| Measure | Product | Location | Time |
|---|---|---|---|
| Sales plan | Subclass | Region | Week |
| Intake plan | Subclass | Region | Week |
| Markdown plan | Subclass | Region | Week |
| Actual sales | SKU | Store | Day |
| Actual stock | SKU | Store | Day |
| Size curve | Subclass | Grade | Season |
| Store share | Class | Store | Season |
| Phasing profile | Subclass | Chain | Week |
Read the last three rows twice. A size curve, a store share and a phasing profile feel like settings. Things somebody configured once, on a tab nobody visits. They are data. Each one was worked out from history, at a grain, under a hierarchy that was true on the day it was worked out. Each one carries every property and every fault of the history it came from. Lesson 2 is what happens when one of them is carried forward and nobody notices it was data.
The two grains, counted
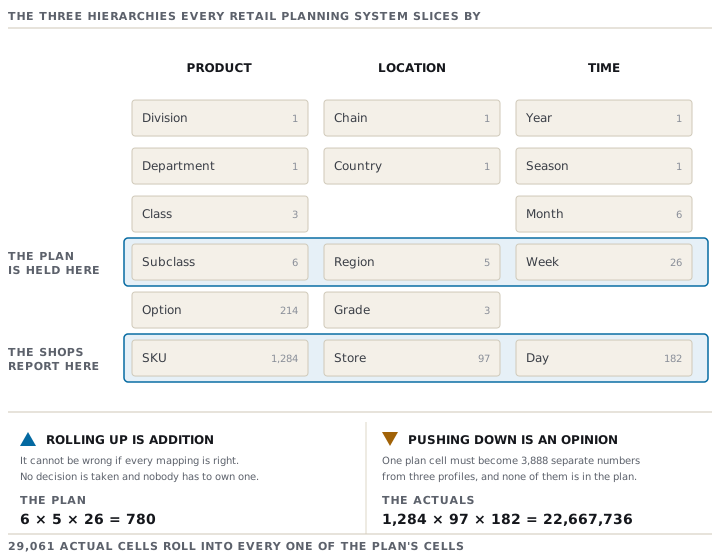
Merrowby's Autumn/Winter plan is six subclasses by five regions by twenty-six weeks:
6 × 5 × 26 = 780 numbersThe actuals arrive at SKU by store by day. Twenty-six weeks is 182 days, and there are 97 locations:
1,284 × 97 × 182 = 22,667,736 numbersTwenty-nine thousand and sixty-one actual cells collapse into every one of the plan's 780. That ratio is not a curiosity. It is the size of the gap that every profile, every allocation rule and every disagreement in the business lives inside.
Rolling up is arithmetic. Pushing down is an opinion.
Going up a hierarchy is addition. It needs no decision. It cannot be wrong if the mappings are right. That is why a total always looks trustworthy.
Going down is the opposite. Take one cell of Merrowby's plan, Wool coats, the North region, week 9, 1,860 units, and try to act on it. You cannot put 1,860 units into a lorry. You need to know which of the 24 wool options, into which of the 27 northern shops, in which of the 6 sizes:
24 × 27 × 6 = 3,888 numbersOne planned number becomes 3,888, and not one of the 3,888 is in the plan. They come from three profiles: an option share, a store share and a size curve. Each of those is data with its own grain, its own history and its own last-updated date.
The reconciliation seam
Two things can be compared only where they meet.
A plan and an actual can be compared at exactly one grain: the coarsest level each can be rolled up to, and only if every mapping between them has been unchanged across the whole comparison window.
Merrowby's seam is subclass by region by week. The plan cannot go finer and the actuals roll up to it happily, so the arithmetic is easy.
The first part is the one everyone knows. The second part is the one that ends seasons. Every mapping means four things. Which SKUs belonged to which subclass then. Which stores belonged to which region then. Which stores were trading at all. And which calendar weeks the week numbers referred to. All four can move without anybody filing a change, because none of them feels like data when you move it.
What a grain costs to change
Changing a grain is not a setting. It is a restatement of every prior period, or the loss of every prior comparison.
- Coarser is always possible and always lossy. You can roll SKU-day up to subclass-week for ever. You can never get back down.
- Finer is usually impossible. You cannot invent a store-level history you never kept. A retailer that planned at chain level for six years and now wants regional plans has six years of history it can only spread out using a profile. That means six years of history it has partly invented.
Which gives the working rule, and it is two rules rather than one:
Store at the finest grain you can afford to keep. Plan at the coarsest grain you can act on.
They are deliberately different grains. The distance between them is exactly where the assumptions live. A business that knows how far apart they are is a business that knows what it does not know.
Check yourselfSomeone asks for last year's sales for the Rainwear subclass, in the Scotland region, for weeks 1 to 6. The number takes four seconds to produce. What do you check before you send it?Show the answer
Whether the two sides of the comparison mean the same thing. Four mappings had to be stable across those six weeks. Which styles were in Rainwear then and are now. Which shops were in Scotland then and are now. Whether every one of those shops was actually trading for all six weeks. And whether last year's weeks 1 to 6 are the same six trading weeks as this year's. Any one of them moving makes the number arithmetically perfect and commercially meaningless. The number is never the hard part. The question is whether it answers the question that was asked.
Prompt · Write down the grain of everything, before anyone buys anything
The week you start looking at planning systems, or any week you cannot say what level a number in your business is stored at.
Act as a retail merchandise systems analyst. I want the data model of my own business written down before I look at any software, because I cannot judge a system against a model I have not stated. My business: [RETAILER], [NUMBER] shops in [WHERE], website [YES OR NO AND HOW IT IS MODELLED], category or department in scope [NAME IT]. My product hierarchy, level by level, with the number of members at each: [LIST IT, TOP TO BOTTOM]. My location hierarchy, the same way: [LIST IT]. My trading calendar: [WHAT IT IS, AND WHETHER A 53RD WEEK IS ADDED]. The measures I plan and report on: [LIST THEM - SALES, UNITS, INTAKE, MARKDOWN, STOCK, MARGIN, ANYTHING ELSE]. Where each one is held today: [SPREADSHEET, SYSTEM, BOTH, NOBODY KNOWS]. Do the following. First, build me one table with a row per measure and a column per dimension, and fill in the level each is held at. Where I have not told you, write UNKNOWN rather than guessing, and list the unknowns separately at the end. Second, identify my reconciliation seam: the coarsest grain at which my plan and my actuals can be compared, and say what breaks the comparison. Third, list every DERIVED number in my business - size curves, store shares, phasing or seasonality profiles, store grades, forecast profiles - and for each one ask me when it was last worked out and which hierarchy version it was worked out under. Treat any one I cannot date as a live risk and say so. Fourth, tell me for each plan cell how many actual cells roll into it, with the arithmetic, and how many separate numbers one plan cell has to become before anyone can act on it. Fifth, list every mapping that would have to stay stable for my year-on-year comparisons to mean anything, and ask me which of them has changed in the last three years. Do not recommend a product. Do not tell me my model is good or bad. Ask for what is missing rather than assuming it.
AI can make mistakes — check anything you act on.