Lessons · Lesson 1 of 3
The test that won on Thursday
Read one A/B test properly: work out its interval from the counts, find the sample the effect really needed, and price the smallest lift worth acting on.
Lesson 1 of 3 · 38 min
The change everybody wanted
Show half a website's visitors one version of a page. Show the other half a different version. Then compare what each half bought. That is an A/B test. It is the closest thing online retail has to a real experiment.
It is also the easiest thing in this business to misread. It gives you a fresh number every morning, and that number moves for reasons that have nothing to do with the page. This lesson takes one such comparison apart.
Ellinghay sells footwear and accessories: boots, loafers, sandals, belts and small leather goods. It has 34 shops and a website. The website takes a little more than half the money.
Boots cause the most trouble. Ellinghay's own returns data for the previous autumn says that 31.2% of boot orders came back. On 19.8% of them the reason code was fit: a boot that pinched across the joint, or swam at the heel. Nobody needed persuading that this cost money.
So Ferris Pledwick, who merchandises the site, proposed a fit-and-width panel for boot product pages. It is a short block above the size selector. It says which lasts run narrow, what the calf measurement of each shaft is, and when to size up. Development quoted GBP 9,400 to build it across the boot range. Keeping the measurements current as lasts change would cost about GBP 4,600 a year. That is GBP 14,000 in the first year.
Delia Skarrow, who runs digital trading, asked for a test rather than a launch. That was the right instinct. Almost everything after it was wrong.
What was measured
The test split the sessions that reached a boot product page. Half saw the page as it was. Half saw the page with the panel. It started on a Monday.
The metric was conversion: the share of boot-product-page sessions that ended in an order containing a boot. Ellinghay's boot pages had converted at 2.4% over the previous eight weeks, on about 1,800 such sessions a day.
Thursday
By Thursday morning the dashboard looked like this. Four days of trading, added up.
| Sessions | Orders | Conversion | |
|---|---|---|---|
| Control, page as it was | 3,612 | 84 | 2.326% |
| Variant, with the fit panel | 3,588 | 99 | 2.759% |
That is a relative lift of 18.6%: 0.02759 divided by 0.02326, less one. Spread over a year of boot sales it read as several hundred thousand pounds of extra revenue. By Thursday afternoon the panel had been signed off for the whole range.
Mirren Odlum, the analyst, was asked to write it up. What follows is the write-up.
What the day-4 numbers actually say
Two rates measured on two samples will differ even when the thing they measure does not. So the question is never "did the numbers differ". They always do. The question is how far apart could they land if the panel changed nothing at all, and whether 0.434 percentage points sits inside that range or outside it.
The tool for that is the standard error: a measure of how much a number like this bounces around by chance alone. For the difference between two rates, it is the square root of the two variances added together.
se = sqrt( pc(1 - pc)/nc + pv(1 - pv)/nv )

   = sqrt( 0.02326 x 0.97674 / 3612  +  0.02759 x 0.97241 / 3588 )
   = sqrt( 0.000006289 + 0.000007478 )
   = sqrt( 0.000013767 )
   = 0.003710   which is 0.371 percentage points
The observed difference is 2.759% less 2.326%, which is 0.434 percentage points. A 95% interval is the range the true effect plausibly sits in. It runs 1.96 standard errors either side of what you measured:
1.96 x 0.371 = 0.727 percentage points

interval  =  0.434 - 0.727  to  0.434 + 0.727
          =  -0.294  to  +1.161  percentage points
Now divide each end by the control's 2.326%. That puts it back in the language everybody was using in the meeting.
| Value | |
|---|---|
| Observed relative lift | +18.6% |
| 95% interval on that lift | -12.6% to +49.9% |
| Two-sided p-value | 0.24 |
Read the middle row aloud. Four days of data are consistent with the panel losing Ellinghay an eighth of its boot sales. They are equally consistent with the panel adding half as much again. The one thing the data cannot do is tell those two apart. There is no finding here to sign anything off with. Not a small finding. Not a promising one. Nothing.
The p-value says the same thing in one number. A p-value is the chance of seeing a gap this big, or bigger, if the change did nothing. Here it is 0.24. So a gap this size would turn up about one time in four from luck alone.
How many observations the effect actually needed
The useful question is not "was Thursday enough". It is "how much would have been enough". That is arithmetic, and you should do it BEFORE the test rather than after it.
To have a good chance of spotting an effect, you must say three things out loud.
- The base rate you are starting from.
- The size of effect you want to be able to see.
- How sure you want to be.
Ellinghay's base rate is 2.400%. The effect the meeting believed in was the +18.6% it had just read, which takes the variant to 2.844%. For the third, take the two ordinary conventions: a 5% false-positive rate on a two-sided test, which gives 1.96 standard errors, and an 80% chance of spotting the effect if it is real, which adds 0.842.
p1 = 0.02400        p2 = 0.02844        pbar = (p1 + p2)/2 = 0.02622

n per arm = ( 1.960 x sqrt(2 x pbar x (1 - pbar))
              + 0.842 x sqrt(p1(1 - p1) + p2(1 - p2)) )^2  /  (p2 - p1)^2

          = ( 1.960 x sqrt(0.0510651) + 0.842 x sqrt(0.0510550) )^2 / (0.00444)^2
          = ( 0.4429 + 0.1902 )^2 / 0.0000197136
          = 0.40078 / 0.0000197136
          = 20,330 sessions in each arm
Ellinghay stopped the test on 3,612 sessions an arm. That is 17.8% of what the effect it believed in would have needed. Not "a bit early". Not even a fifth of the way there.
What the month said
Delia let the test run the full four weeks anyway. That is the only reason this lesson has an ending. Here is the whole thing, added up, at five points.
| Day | Control sessions / orders | Variant sessions / orders | Relative lift | 95% interval on the lift |
|---|---|---|---|---|
| 2 | 1,806 / 40 | 1,794 / 51 | +28.4% | -18.0% to +74.7% |
| 4 | 3,612 / 84 | 3,588 / 99 | +18.6% | -12.6% to +49.9% |
| 7 | 6,318 / 150 | 6,297 / 168 | +12.4% | -10.7% to +35.4% |
| 14 | 12,640 / 302 | 12,602 / 322 | +6.9% | -9.1% to +23.0% |
| 28 | 25,214 / 601 | 25,180 / 622 | +3.6% | -7.6% to +14.9% |
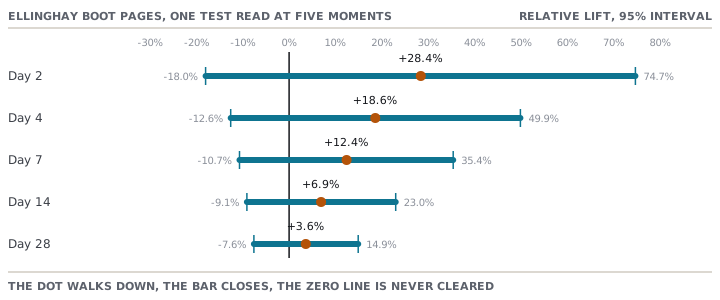
Three things are visible in that table, and all three are general.
The interval narrows roughly with the square root of the sample. Four times the data halves its width. Going from day 7 to day 28 quadrupled the sample. It took the interval from 46 points wide to 22.5 points wide.
The estimate walks downhill. +28.4%, +18.6%, +12.4%, +6.9%, +3.6%. This is not the panel wearing off. It is what an early estimate does. On day 2 noise dominates the number, and noise that happened to be positive is the only reason anyone was looking at this test on Thursday. Lesson 2 measures exactly how big that bias is.
Nothing ever became significant. The final interval, on 1,223 orders, still runs from -7.6% to +14.9%. After a month, Ellinghay knows that the panel is very unlikely to have changed boot conversion by more than about a seventh in either direction. It knows nothing else.
The lift that would have paid for the panel
Here is the question nobody asked in the sign-off meeting. It is the one that decides whether the test was ever worth running.
Boot product pages take about 1,800 sessions a day, so 657,000 a year. At 2.4% that is 15,768 boot orders. Ellinghay's gross margin on a boot order averages GBP 42.00, so call the boot page's contribution GBP 662,256 a year.
The panel costs GBP 14,000 in year one. So it pays for itself at:
14,000 / 662,256 = 2.11% relative liftNow put 2.11% back into the sample-size arithmetic. p1 stays at 0.02400. p2 becomes 0.024506. The difference in the denominator is 0.000506 instead of 0.00444. That is nearly nine times smaller, and it is squared.
| Relative lift to be detected | Sessions needed in each arm | Days at 900 sessions an arm a day |
|---|---|---|
| +18.5% | 20,330 | 23 |
| +10.0% | 66,946 | 74 |
| +5.0% | 261,572 | 291 |
| +2.1% | 1,448,625 | 1,610 |
To detect the smallest lift that would actually pay for the panel, you need about 1,610 days of boot traffic in each arm. That is four and a half years. The boots will have been discontinued twice over.
That is the real finding of this test, and it is worth more than the result would have been:
Ellinghay's boot pages cannot answer this question. The effect that matters commercially is smaller than the smallest effect the traffic can see.
What you do with a question your traffic cannot answer
There are four honest responses. Three of them are fine.
- Decide it on other evidence and say so. The panel's real case was never conversion. It was the 19.8% of boot returns coded as fit. A return costs Ellinghay carriage both ways, handling, and on a late-season boot a markdown too. Measure THAT instead. It is a rate on orders, and if the panel moves returns from 31.2% to 28% it is worth having whatever conversion does.
- Test something bigger. A test can only see effects of a certain size. So spend the traffic on changes that might plausibly produce one. A fit panel is a refinement. A change to how boots are sized, priced or shipped is not.
- Widen the unit. The panel could go on every footwear page rather than boots alone. That raises the traffic by roughly four times and cuts the days needed by the same. You are then testing a different, broader question, and you must say so.
- Run it for four days and call it. This is what happened. It is the only one of the four that produces a number nobody can rely on while feeling like rigour.
Check yourselfA colleague shows you a test on your accessories pages: 5,100 sessions an arm, 61 orders in the control and 76 in the variant, and says it is up 24.6% and should ship. What do you compute first, and what would you need to know to say whether the test could ever have answered the question?Show the answer
First compute the interval. The rates are 1.196% and 1.490%, a difference of 0.294 percentage points. The standard error is the square root of (0.01196 x 0.98804 / 5100) plus (0.01490 x 0.98510 / 5100), which is 0.00228. So 1.96 standard errors is 0.447 points, and the interval on the difference runs from -0.153 to +0.741 points. As a relative lift that is -12.8% to +62%. The honest statement is "somewhere between meaningfully worse and much better". Then ask the two commercial questions. What does the change cost, and what relative lift on accessories gross margin pays for it? That break-even lift may be smaller than what this traffic can detect in a sensible number of weeks. Compute it, do not guess. If it is smaller, no amount of patience will settle the question, and the decision has to be made on something other than this test.
Prompt · Read this test result honestly
When somebody sends you a lift and asks whether to ship it.
You are a careful analyst. I will give you the raw counts from an online A/B test. Tell me what can and cannot be concluded. Do not use rules of thumb and do not cite industry benchmarks. Work only from my numbers.

Control: [sessions] sessions, [orders] orders.
Variant: [sessions] sessions, [orders] orders.
What the change costs to build and keep: [amount] a year.
Annual sessions on this surface: [number]. Gross margin an order: [amount].

Do all of this and show the arithmetic:
1. Both conversion rates, the absolute difference in percentage points, and the standard error of that difference as the square root of pc(1-pc)/nc plus pv(1-pv)/nv.
2. The 95% interval on the difference and on the relative lift, and a plain sentence saying what the interval does and does not rule out.
3. The sample each arm would have needed to detect the observed effect at 80% power and a 5% two-sided false-positive rate, and what fraction of it I actually have.
4. The break-even relative lift implied by the cost and the margin, and the sample needed to detect THAT.
5. A one-line recommendation: ship, do not ship, keep running to a stated date, or the question cannot be answered by this traffic.

End by naming anything in my figures that would change your answer.
AI can make mistakes — check anything you act on.