Lessons · Lesson 3 of 3
The number that moved and the business that did not
Take a headline rate apart by mix, put both periods on one fixed mixture, and set a reporting rule that stops a metric moving while the business stands still.
Lesson 3 of 3 · 36 min
October, on the first slide
An average is a mixture. A mixture can change without any of its ingredients changing. That is how one headline percentage moves up while every group underneath it moves down. There is no error in the data and nothing to fix in the business. This lesson takes one such month apart to show the mechanism.
Ellinghay rebuilt the site navigation over the summer and shipped it on the first of October: fewer top-level categories, a size filter that stays on screen, and a new landing page for each footwear family. It was a real piece of work, and everybody wanted to know whether it had paid.
The first slide of the November trading pack said it had.
| Sessions | Orders | Conversion | |
|---|---|---|---|
| September | 790,000 | 19,110 | 2.4190% |
| October | 597,000 | 15,772 | 2.6419% |
Conversion up 9.2% on the month. The navigation was declared a success in the meeting, the agency was thanked, and a second phase was scheduled for the spring.
Now the second slide. It was in the pack, and nobody read it out.
| September sessions | September conversion | October sessions | October conversion | Change in the rate | |
|---|---|---|---|---|---|
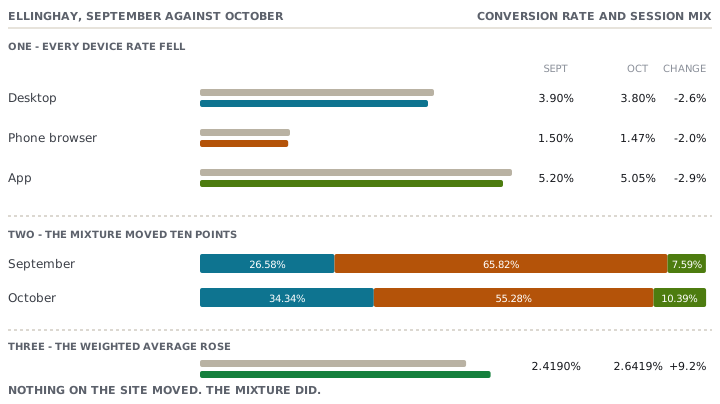
| Desktop | 210,000 | 3.90% | 205,000 | 3.80% | -2.6% |
| Phone browser | 520,000 | 1.50% | 330,000 | 1.47% | -2.0% |
| App | 60,000 | 5.20% | 62,000 | 5.05% | -2.9% |
Every device converted worse in October than in September. The total converted better. Both statements are arithmetically true. They are computed from the same rows, with no error anywhere.
How a whole can rise while all of its parts fall
A total conversion rate is not a measurement in its own right. It is a weighted average of the parts, and the weights are each part's share of the sessions.
| September share of sessions | October share of sessions | |
|---|---|---|
| Desktop, converting near 3.9% | 26.58% | 34.34% |
| Phone browser, converting near 1.5% | 65.82% | 55.28% |
| App, converting near 5.1% | 7.59% | 10.39% |
Phone is by far the worst-converting surface Ellinghay has. In October it made up ten points less of the traffic. So ten points of weight moved off a 1.5% rate and onto rates of 3.8% and 5.05%. That shift is worth far more to the headline than the small decline inside each group is worth against it. So the average rises while every component falls.
You can watch it happen with the October rates alone. Weighted by September's mix they average 2.3613%. Weighted by October's mix, the very same three rates average 2.6419%. The rates did not change between those two calculations. Only the mixture did.
What actually happened in October
Ellinghay ran a paid-social campaign through September and switched it off on the thirtieth. It delivered about 190,000 phone sessions in the month. Those sessions converted at essentially the phone average, 1.50%, which matters for the arithmetic below: removing them did not change the phone rate, only the phone volume.
It was switched off because it lost money.
| Sessions delivered | 190,000 |
| Orders at 1.50% | 2,850 |
| Gross margin at GBP 38.00 an order | GBP 108,300 |
| Media spend at GBP 0.66 a session | GBP 125,400 |
| Contribution | -GBP 17,100 |
So the decision to stop it was correct. The conversion rate rose as a direct consequence of a correct decision. That is exactly why the rise is not evidence of anything about the navigation. The metric moved because the traffic mixture moved. The site had nothing to do with it.
Standardising: what the navigation actually did
The fix is old and it is arithmetic. Compute both months on the same mixture. The mix effect then cancels out, leaving whatever the site did. That is what standardising means.
Take October's rates and apply them to September's traffic mix.
| September sessions | October's rate | Orders that would have produced | |
|---|---|---|---|
| Desktop | 210,000 | 3.80% | 7,980 |
| Phone browser | 520,000 | 1.47% | 7,644 |
| App | 60,000 | 5.05% | 3,030 |
| Total | 790,000 | 18,654 |
That is 2.3613% against September's actual 2.4190%, which is a like-for-like change of -2.4%.
Now run it the other way as a check. Take September's rates onto October's mixture: 205,000 at 3.90%, 330,000 at 1.50% and 62,000 at 5.20% is 16,169 orders on 597,000 sessions, or 2.7084%, against October's actual 2.6419%. That is -2.5%. The two standardisations agree, which is what you want to see before you trust either.
Headline conversion: up 9.2%. Conversion on a constant mix of traffic: down about 2.4%.
What the difference is worth in money
A percentage that has been argued about for an hour is worth converting into pounds before the meeting ends.
| At September's rate | Actually | Orders lost | Gross margin an order | Margin lost | |
|---|---|---|---|---|---|
| Desktop | 7,995 | 7,790 | 205 | GBP 44.00 | GBP 9,020 |
| Phone browser | 4,950 | 4,851 | 99 | GBP 38.00 | GBP 3,762 |
| App | 3,224 | 3,131 | 93 | GBP 46.00 | GBP 4,278 |
| Total | 16,169 | 15,772 | 397 | GBP 17,060 |
The month's decline in conversion cost about GBP 17,060 of gross margin. That is within a hundred pounds of what the cancelled campaign had been losing. The coincidence is a useful one, because it puts the two numbers on the same slide at the same size.
None of this proves the navigation caused the decline. October is not September. The weather turned, the boot season started, half-term fell differently, and prices moved. A standardised comparison removes the mix effect and nothing else. What it does establish is that the 9.2% on the first slide was not evidence of improvement. Whatever the navigation did, it did not show up as more orders per session from a comparable mixture of visitors.
Where else this bites, in the same shape
It bites on any ratio reported for a whole that is made of unequal parts. Ellinghay has met all of these:
- Average order value up 6% in January, because the January mixture is full-price accessories and clearance boots, and the clearance channel had closed. Basket sizes did not move.
- Returns rate down in the spring, because boots are 31.2% returns and sandals are a fraction of that. Nothing about fit improved.
- Gross margin percentage up in a week when a wholesale drop was late, so the mixture was all retail.
- Cost per acquisition down after a brand campaign ended, because the remaining spend is on the cheapest, most-intentional searches.
Declare the unit, too
One related trap, because it produces the same symptom from a different cause.
A session is not a person. A change may make shoppers come back more often: a saved basket, a wishlist, a size reminder. Then one buyer who used to arrive once now arrives three times. Session conversion falls by two thirds with exactly the same orders and exactly the same money. Conversion per customer would be unchanged. Neither number is wrong. They answer different questions, and a change that moves the number of visits per person moves them in opposite directions.
So the unit of analysis is a declaration, not a detail. Say which one the target is set in, and use the same one for the test and for the report. If a change is expected to alter how often people visit, the per-session figure is the one that will mislead you.
Check yourselfYour marketplace channel is paused for six weeks. Site conversion rises from 2.1% to 2.5% and average order value rises 8%. The board asks whether the new product pages are working. What do you show them?Show the answer
Not the headline. Split both periods by channel and show the rate of each part. The marketplace traffic was the lowest-converting and lowest-value share of the mixture, so removing it lifts both averages arithmetically, whatever the pages do. Then standardise: apply this period's per-channel rates to the previous period's channel mix, and check it the other way round as well. If the two standardisations agree, quote the like-for-like change and name the basis you held constant. Put the money beside it: orders and gross margin for both periods, because the paused channel took its sales with it and the pack should not be able to show a rise while the business shrank. Only then answer the question that was asked, which the comparison cannot settle on its own. A period-on-period difference contains the season, the weather and the price changes as well as the new pages. So the honest answer is that the pages need a controlled test, and this comparison is not one.
Prompt · Is this rate moving, or is the mixture moving?
When a headline rate improves and you want to know what is underneath it.
I have a rate that changed between two periods. I need to know whether the underlying behaviour changed or only the mixture of traffic did.

Period A and period B, split by [device, channel, category or whatever moved]. For each part and each period I will give you sessions and orders:
[paste the rows]

Do this:
1. Compute each part's rate in both periods, and each part's share of sessions in both periods.
2. Say whether any part's rate moved in the opposite direction to the total, and if so name it.
3. Standardise: apply period B's rates to period A's mixture, and then period A's rates to period B's mixture. Report both like-for-like changes and say whether they agree.
4. Put the money beside it: orders and gross margin in both periods, using [margin an order] if I have not given you a per-part figure.
5. Write the two sentences I should put in the trading pack, one for the headline rate and one for the like-for-like rate, naming the basis you held constant.

If something other than my named dimension might have moved, say what it is and what data you would need to check it. Do not tell me the change is good or bad without the money.
AI can make mistakes — check anything you act on.