Lessons · Lesson 2 of 3
Inspecting harder finds more, and prevents none
Separate defects made from defects found, price a month of extra inspectors against a month of root-cause work, and see why detection lag decides what a gate is worth.
Lesson 2 of 3 · 34 min
The situation
When a buyer complains about quality, most factories put more people on the checking table. This lesson asks what that decision actually buys. The word defect covers two different things. One is how many faults the line makes. The other is how many faults somebody writes down. Only one of them can be reduced for good.
Week three of QT-4471. Chenab's line 4 runs the CS-260 skirt: 44 operators, 26 operations, 720 skirts a day over a nine-hour day, so 80 an hour. Three checkers sit at the end of the line and look at every piece.
The end-of-line log for the first fortnight says the line is running at DHU 11.4. DHU means defects per hundred units, so that is eleven and a bit defects for every hundred skirts made. Quintela's technologist has seen the log, does not like it, and says so on a call. The factory answers the way every factory answers: we will put more checkers on the line.
Three more checkers join the end-of-line table the following Monday. This lesson is about what happened next. Read it slowly. On the face of it the factory did the right thing, and the numbers came out wrong.
Two different measurements that people say with the same word
Before the numbers, one distinction. Almost every argument about quality in a factory is two people using the word "defects" to mean two different quantities.
- Defects made. How many faults the line produces. It is a property of the process: the machines, the folders, the methods, the fabric, the training. Nothing an inspector does changes it. This is what DHU measures.
- Defects found. How many faults somebody wrote down. It is a property of the inspection: how many checkers, how hard they look, how the shipment is going, what they were told this morning.
Defects found goes up when you look harder. Defects made does not move at all. And the number reported upwards is almost always the one that was found. So a factory can run a whole improvement programme on a number that measures its own attentiveness.
The escape is the third quantity, and it is the only one the buyer ever meets: defects made, minus defects found, equals defects shipped.
What the extra checkers actually bought
Here is the month, in the only unit that settles it: a day of line 4.
| Month 1: 3 checkers | Month 2: 6 checkers | Month 3: 3 checkers, line fixed | |
|---|---|---|---|
| DHU, defects per hundred units | 11.4 | 11.4 | 6.8 |
| Defects made per day, out of 720 | 82 | 82 | 49 |
| Share of them the table catches | 78% | 91% | 78% |
| Caught and repaired per day | 64 | 75 | 38 |
| Escaping into the cartons per day | 18 | 7 | 11 |
| Escapes as a share of output | 2.5% | 1.0% | 1.5% |
| Repair labour per day, USD | 14.08 | 16.50 | 8.36 |
| Checkers per day, USD | 39.60 | 79.20 | 39.60 |
| Cost of the arrangement per day, USD | 53.68 | 95.70 | 47.96 |
Read the second row across. Eighty-two defects a day were made in month 1, and eighty-two were made in month 2. Doubling the checkers changed nothing at all about the garments coming off the line. It changed only how many of them somebody stopped. The bottom row is what the change cost: USD 95.70 a day against USD 53.68, so an extra USD 42 a day, and about USD 1,092 over a 26-day month.
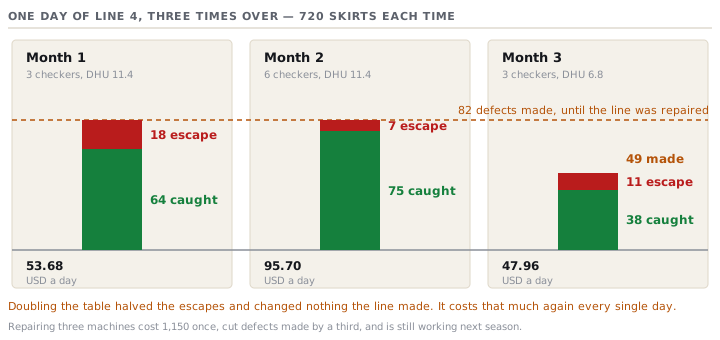
Now read month 3, and be honest about what it says and what it does not.
The part that is usually told dishonestly
The comfortable version of this lesson ends here: inspection is waste, fix the process, everybody nods. The numbers do not quite say that, and the difference is the useful part.
Month 3 is what happened when the quality manager spent USD 1,150, once, on the three defect codes that made up most of the log. There was a worn needle plate on operation 14 that was snagging the corduroy pile. There was a hem folder on operation 9 that a mechanic had re-set and nobody had re-checked. And there was a change to how the fabric was relaxed in the store. DHU fell from 11.4 to 6.8. Defects made per day fell from 82 to 49. That is thirty-three garments a day that no longer need repairing, and it happened once and stayed.
But look at the escape row. Month 2, the expensive and supposedly wrong answer, put 7 defective skirts a day into the cartons. Month 3, the right answer, put 11 in. Six checkers on a bad line protected the buyer better than three checkers on a good one.
So inspection is not useless. Anybody who tells a factory it is has never had a container rejected. What is true is narrower and more useful:
Inspection is a reduction in escapes that you rent, by the day, forever. Process change is a reduction in defects that you buy, once. Only one of them is still working next season, and only one of them gets cheaper.
The month-4 row that nobody ran is the answer to the exam question. Six checkers on the fixed line make 49 defects a day, catch 45, and escape 4, which is 0.6% of output, at USD 89.10 a day. The lowest escape rate on the page costs the most per day. So you do not choose between the two. You choose the order you do them in, and doing the process work first makes every inspector you then hire cheaper per escape prevented.
Detection lag: the number that says what a gate is worth
Here is the mechanism underneath all of it. If you take one idea out of this course, take this one.
A fault does not usually arrive alone. An operation drifts. A folder loosens, a needle blunts, a bundle of panels from a different roll goes up the line. From that moment every piece through that operation carries the fault, until somebody notices. The number of garments carrying the fault is the line rate multiplied by how long it took to notice. That interval is the detection lag, and it is the only thing that separates a cheap gate from an expensive one.
| Found by | How long before anybody sees it | Pieces carrying the fault | Unit cost at that gate, USD | Total, USD |
|---|---|---|---|---|
| Roving inline check, hourly | half an hour on average | 40 | 2.86 | 114 |
| End of line | the work in progress ahead of it, most of a shift | 640 | 6.10 | 3,904 |
| Final audit, after packing | days | the lot | — | the lot |
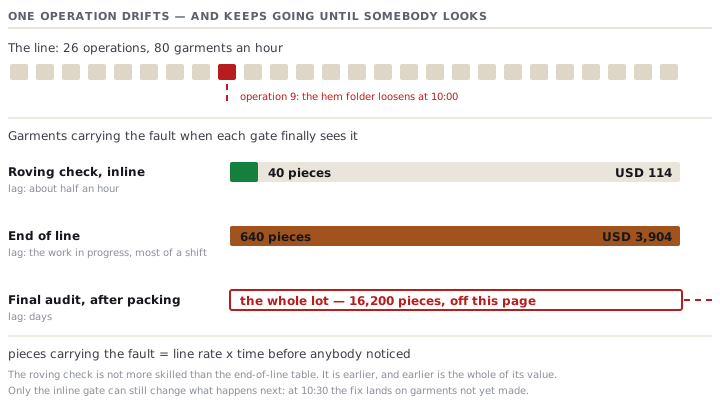
USD 114 against USD 3,904 for the identical fault. Thirty-four times the money, and the only difference is that one gate looked every hour and the other looked at the end. The roving check is not more skilled than the end-of-line table. It is earlier, and earlier is the whole of its value.
This is also why the inline gate is the only one of the four that can genuinely prevent anything. When a roving QC finds a drifting folder at 10:30, the fix goes onto the operation and the next six hundred skirts are made correctly. When the end-of-line table finds the same thing at 16:00 the next day, six hundred skirts already exist, and the only decision left is what to do with them.
The report that cannot be wrong
One last trap, and it catches experienced people.
A monthly quality report says: "defects found down 18% on last month, so quality is improving". The same report next quarter says: "defects found up 22%, so our new inspection regime is working". Both sentences are unfalsifiable, and you can tell because either direction is presented as good news. A number that means success when it rises and success when it falls is not a measurement.
Three things must sit beside a defect number before anybody can read it.
- The denominator. Defects per hundred units, not defects. A count with no output figure behind it tells you about the size of the month.
- The check rate. How many pieces were looked at, by how many people, at what stage. A change in this number changes the defect count without changing a single garment.
- The breakdown by code. Twenty-two defects from one operation is a mechanic's afternoon. Twenty-two defects spread across fourteen codes is a process nobody is controlling, and it is a far worse result even though the total is identical.
Prompt · Turn a month of defect log into three fixes
The morning after a technologist tells you your defect rate is too high and the only idea in the room is more checkers.
Act as an industrial engineer who has run sewing lines and is sceptical of quality programmes. I will give you a month of end-of-line defect data and I want three fixes, not a report. Line facts: [NUMBER] operators, [NUMBER] operations, output [PIECES] a day over [HOURS] hours, style [STYLE], fabric [DESCRIBE IT]. End-of-line checkers: [NUMBER], and my best estimate of the share of defects they actually catch is [PERCENT] — say so if you think that estimate is unlikely. Loaded operator cost [AMOUNT] an hour; average repair time [MINUTES]. The log, by defect code and count: [PASTE IT]. Where each defect is found, if I know: [OPERATION NUMBERS]. Do the following. First, convert the log into defects per hundred units and tell me how many defects the line MAKES per day, how many are caught and how many escape into the cartons, with the arithmetic shown. Second, sort the codes by count and tell me how many codes account for most of the log. Third, for the top three codes, give me the most likely mechanical, method and material causes in that order, and for each one name the single check that would confirm or clear it in under an hour. Fourth, estimate the detection lag for each of those three, meaning how long between the fault starting and somebody noticing, and multiply it by my line rate to tell me how many pieces carry it each time it happens. Fifth, tell me what adding three more end-of-line checkers would and would not change, in numbers, against what fixing the top three codes would change. Sixth, write the three fixes as instructions to a named role with a date, not as recommendations. If my data cannot support a conclusion, say which extra number you need.
AI can make mistakes — check anything you act on.
Check yourselfYour DHU is 11.4 and your end-of-line table catches 78% of what the line makes. Over a 16,200-piece order at 720 a day, roughly how many defective garments reach the cartons?Show the answer
Eighteen a day. The order takes 22.5 days, so about 405 garments, which is 2.5% of the shipment. Do the arithmetic in that order and it is unarguable: 720 times 11.4 per hundred is 82 defects made, 78% of 82 is 64 caught, so 18 escape. The point is not the number itself. It is that you can work it out on a Tuesday, from figures you already have, without opening a single carton. Most factories discover their escape rate when somebody else measures it for them.
Check yourselfA supervisor asks to move the roving QC to the end-of-line table for a week because the shipment is tight. What do you say?Show the answer
That it is the wrong direction, and you can price it. The roving check finds a drifting operation after about 40 pieces. The end-of-line table finds it after most of a shift, call it 640. Moving that person shortens nothing and lengthens the detection lag on every operation they were covering, which is the one variable that multiplies. If the shipment is genuinely tight, you want the inline gate working harder, not the end-of-line table fuller, because only the inline gate can stop the next six hundred skirts from needing repair. The instinct to mass at the end of the line when time is short is universal, and it is exactly backwards.