Lessons · Lesson 1 of 3
What your own numbers can tell you, and what they cannot
Read one season of sell-through, size and returns data honestly, and find the figure in it that measures the range and not the product.
Lesson 1 of 3 · 38 min
The situation
A garment that nearly sold out looks like the easiest decision in the business. Buy more of it next time. This lesson is about why that reading is so often wrong. The share of a garment that sells is also a fact about everything standing next to it. Take the neighbour away, and the same garment sells faster without one customer changing her mind. The same trap runs through sizes, colours and returns.
9 March, 08:40, head office of Halgarth, a womenswear chain with 41 shops and a website. On the table is the autumn knitwear post-season pack. One line at the top is ringed in pencil.
HG-4471, a lambswool crew neck at GBP 45.00, sold through at 96.2%.
The recommendation underneath it is one sentence long: buy it deeper. Every figure behind that sentence is correct. The recommendation is wrong. Understanding why is the most useful thing in this course.
Two words, two meanings — settle it once
Across this track the buyer chooses the product. The merchandiser owns the numbers: the money available to spend, when it is spent, how the stock is split between shops, and the markdown. On the supply side of the same order, "merchandiser" means the person who runs the order through a factory. That is the job course 7.1 describes. Both uses are correct. Say which chair you are sitting in the first time it matters. This course sits in the buyer's.
Now three words that every number below rests on. An option is one product line in the range — one garment, as the range plan counts it. Rate of sale here is full-price units sold per selling point per week, and Halgarth counts its website as a forty-second selling point. Sell-through is everything sold by the end of the eighteen-week season, divided by what was bought. Full-price sell-through counts only the units that went at the ticket price. The gap between those last two is where most bad decisions live.
Two complaints, one cause
On 18 November the retail director wrote that the shops had nothing left to sell in wool. In January the merchandiser reported that autumn knitwear finished with 3,479 units of stock left over, of which 1,428 — 41.0% of the whole leftover — sat in a single option, the GBP 25.00 cotton crew neck.
Those read like two problems. They are one problem. Here is the range that produced both. Landed cost in the table below is what the garment costs to get onto Halgarth's own shelf: the factory price plus freight, duty and handling.
| Option | Description | Retail | Landed cost | Bought | Sell-through | Full-price sell-through |
|---|---|---|---|---|---|---|
| HG-4403 | Cotton crew neck | GBP 25.00 | GBP 8.90 | 6,800 | 79.0% | 48.0% |
| HG-4415 | Fine-gauge roll neck | GBP 35.00 | GBP 11.10 | 5,200 | 94.0% | 76.0% |
| HG-4428 | Cotton cable cardigan | GBP 39.00 | GBP 13.05 | 3,100 | 85.0% | 58.0% |
| HG-4471 | Lambswool crew neck | GBP 45.00 | GBP 14.20 | 4,200 | 96.2% | 88.2% |
| HG-4472 | Lambswool v-neck | GBP 45.00 | GBP 14.20 | 2,600 | 92.0% | 73.0% |
| HG-4486 | Wool-blend cable cardigan | GBP 69.00 | GBP 22.80 | 1,900 | 81.0% | 47.0% |
| HG-4490 | Chunky wool jumper | GBP 79.00 | GBP 26.10 | 1,150 | 76.0% | 42.0% |
| HG-4494 | Merino roll neck | GBP 89.00 | GBP 30.40 | 900 | 70.0% | 38.0% |
Read the retail column downwards before you read anything else. The prices run 25, 35, 39, 45, 45 — and then jump to 69. A customer who wanted a wool jumper and did not want to spend GBP 69.00 had exactly two things to choose from, both the same yarn at the same price, one with a crew neck and one with a v. Between GBP 46.00 and GBP 68.00, Halgarth sold nothing at all.
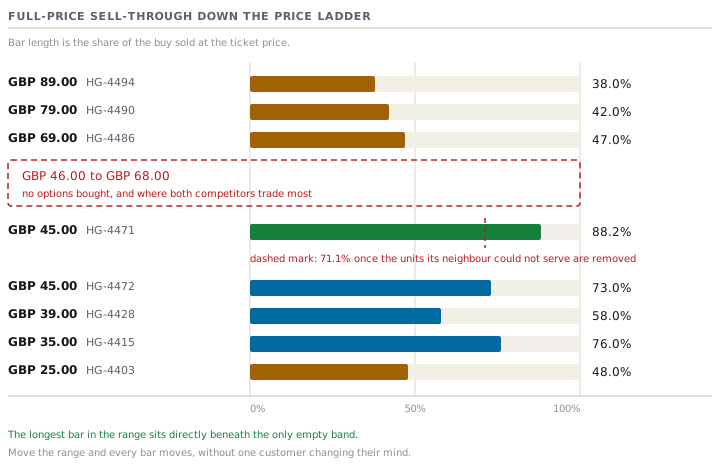
Sell-through is a property of the range, not of the product
This is the sentence to take away, and it is not a figure of speech. Sell-through is a ratio. The top of it is the demand that reached one option. The bottom is a quantity you chose. Both halves are yours. Change the range around an option and its sell-through moves, without a single customer changing their mind. Take its neighbour away, add one beside it, or move a price, and the number shifts.
HG-4471 was the only lambswool crew in the range. It sat at the only entry price into wool, next to one option that was the same garment with a different neck. It did not compete for its 96.2%. It was handed it.
That is a story, not yet a finding. A finding needs evidence. Here is how you get it out of data you already own.
The clean-weeks test
Halgarth's weekly sales file holds the rate of sale for every option in every week. Split the season at week 11, which is the week HG-4472 went out of stock in sizes 12 and 14 across most of the estate.
| Weeks 1 to 10 | Weeks 11 to 18 | Factor | |
|---|---|---|---|
| HG-4471 lambswool crew | 3.1 | 7.1 | 2.31 |
| HG-4472 lambswool v-neck | 3.0 | 1.9 | 0.65 |
| Whole knitwear category | 17.0 | 27.4 | 1.62 |
The crew's rate of sale more than doubled. The temptation is to call that acceleration and buy into it. The temptation is wrong, because the whole category accelerated. It gets cold in November, and it always does. The category factor of 1.62 is that seasonal rise, and it is free: you get it whether your product is good or not.
So take it out. The crew ran at 2.31 times its early rate, where the season alone explains 1.62. Divide one by the other and 1.43 is left. That is a 43% lift on top of the season, beginning in the week its neighbour ran out.
Put that in units. At 3.1 a week lifted only by the season, the crew would have sold about 1,685 units at full price in weeks 11 to 18. It actually sold 2,402. The difference is 717 units, which is 19.4% of everything it sold at full price. Take those away and its full-price sell-through is 71.1%, not 88.2%.
The v-neck is the other half of the same arithmetic. It should have sold about 1,613 units in those weeks and sold 652, a shortfall of 961 units. The crew picked up 74.7% of them. Three quarters of the demand the v-neck could not serve simply walked next door.
Sizes: you only measured demand where you had stock
| Size | Bought | Share of the buy | Full-price units | Full-price sell-through | Ran out |
|---|---|---|---|---|---|
| 8 | 340 | 8.1% | 211 | 62.0% | no |
| 10 | 630 | 15.0% | 554 | 88.0% | no |
| 12 | 890 | 21.2% | 881 | 99.0% | week 9 |
| 14 | 890 | 21.2% | 881 | 99.0% | week 10 |
| 16 | 700 | 16.7% | 658 | 94.0% | week 14 |
| 18 | 470 | 11.2% | 385 | 82.0% | no |
| 20 | 280 | 6.7% | 176 | 48.0% | no |
Sizes 12 and 14 read 99.0%. That figure tells you nothing about demand after the day the stock ran out. A size that sold out is a censored observation — a measurement that stopped early. You know demand was at least 881, and you do not know what it really was. The only sizes whose demand you genuinely measured are the ones that never ran out: 8, 10, 18 and 20. Those are the sizes you bought too many of.
This is the shape of the whole lesson in one table. The data is strongest exactly where you were wrong, and weakest exactly where you need it.
Colour, and the colour that is not in the table
| Colour | Bought | Full-price units | Full-price sell-through |
|---|---|---|---|
| Navy | 1,890 | 1,738 | 92.0% |
| Charcoal | 1,470 | 1,294 | 88.0% |
| Oatmeal | 840 | 672 | 80.0% |
Navy beat oatmeal by 12 percentage points. That is a real reading, and it has a limit. It says navy outsold oatmeal in a range containing navy, charcoal and oatmeal. It says nothing at all about brown, rust, forest or bottle, because Halgarth did not buy them. Your sales file is a complete record of one experiment you ran. It is silent on every experiment you did not.
That silence is the limit of this lesson and the reason the next two exist. There are only three ways to learn about the option you did not stock. Put a test buy in and measure it. Look at what somebody else stocked (lesson 3). Or pay for a view of what is coming (lesson 2). Analysis of your own file, however clever, is not one of them.
Returns tell you about the people who bought
HG-4471 sold 628 of its full-price units online. 92 of those came back — 14.6%, against a knitwear online average of 11.2% — and 58% of the returns were coded "too small". That is 53 garments.
Fifty-three is a small number, and it should not carry a buying decision on its own. It carries this one because it agrees with something built on 4,200 units: the size table, where 12 and 14 ran out in weeks 9 and 10. Two weak signals from separate sources, pointing the same way, are worth more than one strong signal. The size curve was too flat. Both readings say so, and each was produced in a different way.
Now the opposite case, which is the trap. HG-4494, the merino roll neck at GBP 89.00, had the lowest return rate in the range at 6.8%. It sold 342 units at full price, 44 of them online, and three came back. A rate worked out on 44 units measures nothing. Even if it did, it would only describe the people who bought. A category with no returns is not evidence that it fits. In shops, which took 83% of this range's units, a customer who takes a garment into a fitting room and puts it back leaves no record at all. The absence of a complaint is the absence of data.
What positive evidence would have looked like
The reassuring reading — this is a strong product, buy more of it — needs proof that something good actually happened. The absence of anything going wrong is not proof. Four tests, all of which can be run on Halgarth's own files:
- Full-price sell-through in clean weeks only. Count only the weeks in which every option in its price band was in stock. HG-4471 ran at 3.1 a week against 2.6 for the other three options in the GBP 35.00 to GBP 45.00 band over the same weeks. Both figures come out of the same weekly file. It is genuinely above average, by 19%. That is a good product, and it is a very different sentence from 96.2%.
- Spread across the shops. Does it sell in the smallest twenty shops as well as the largest twenty? HG-4471 does. An option that only works in six flagship shops is a six-shop option.
- Returns at or below the category rate. It is above, at 14.6%. The reason is a size curve, not the product.
- Repeat purchase. Of the customers who bought a lambswool crew two autumns ago, how many bought knitwear again? Halgarth cannot answer this. Saying so is better than assuming it.
Three of the four are met and one is not. The honest summary is a good option whose headline number belongs to the range.
Prompt · Read the post-season pack the hard way
The morning a review pack lands with one option ringed and a recommendation to buy it deeper.
Act as a retail merchandiser who has no attachment to any option in this range, and who has to defend every number to a finance director. Here is one category's post-season data. Range: [LIST EVERY OPTION WITH CODE, DESCRIPTION, RETAIL PRICE, LANDED COST, UNITS BOUGHT, UNITS SOLD AT FULL PRICE, UNITS SOLD IN MARKDOWN, UNITS LEFT AT SEASON END]. Selling points: [NUMBER OF SHOPS, AND WHETHER THE WEBSITE IS COUNTED AS ONE]. Season length: [WEEKS]. Weekly rate of sale by option, if I have it: [PASTE]. Size-level data for the option under discussion: [SIZE, UNITS BOUGHT, UNITS SOLD AT FULL PRICE, WEEK IT RAN OUT]. Colour-level data: [COLOUR, UNITS BOUGHT, UNITS SOLD AT FULL PRICE]. Online share and returns: [ONLINE UNITS, RETURNS, RETURN REASONS]. Do the following. First, restate the range as a price ladder and name every price band with no option in it, and every band with more than one option at the same price. Second, for each option give both sell-through and full-price sell-through, and say plainly which of the two the recommendation in front of me is using. Third, find every option whose rate of sale changed a lot in the week another option ran out, take the category's own seasonal factor out of that change, and tell me in UNITS how much of its sales were demand that moved across from a neighbour. Fourth, mark every size and colour whose observation is CENSORED because it ran out, and say what can and cannot be concluded from it. Fifth, tell me what positive evidence would be needed to call this option strong, and which of those tests it actually passes. Sixth, give me the buy decision as three lines: what to hold, what to change, and what question this data cannot answer at all. Do not use the phrase strong performer anywhere, and name every assumption you make.
AI can make mistakes — check anything you act on.
The decision this produces
Not "buy the crew deeper". The evidence supports something narrower and more useful:
- The crew is a good option, worth roughly the units it had. Its extra 717 units belong to the price band, not to it.
- The v-neck's problem is a size curve, not demand. Its implied demand was 2,858 against a buy of 2,600.
- There is a hole between GBP 46.00 and GBP 68.00 that took two full seasons to become visible. The evidence for it is not an opinion. It is 717 units of measured overflow into the option below it.
What goes into that hole, and how the range is balanced around it, is course 16.2's subject. This lesson hands 16.2 an input: the band is empty, the demand for it is measured, and here is the arithmetic. What you cannot get from this file is whether the thing that fills it should be brown. That is next.
Check yourselfAn option finished the season at 97% sell-through and is the strongest number in your pack. Name the two figures you would ask for before you buy it deeper.Show the answer
Its full-price sell-through, and its rate of sale in the weeks every neighbour in its price band was in stock. The first separates demand from discounting. An option can reach 97% with a third of its units given away at half price, and that is a markdown story, not a product story. The second separates the option from the range. If its rate of sale jumped in the week a neighbour ran out, some of that 97% is demand you already owned and are about to buy a second time. Both figures sit in a weekly sales file you already have. Neither appears in a post-season pack unless somebody asks.
Check yourselfYour outerwear category has the lowest return rate in the business. The buyer says this proves the fit is right. What is wrong with that?Show the answer
A return rate measures the people who bought and kept the garment, and nothing else. The customers who tried a coat on in a shop and put it back leave no record at all, and in a shop-led category they are most of the traffic. So a low return rate can equally mean a garment nobody risked buying. It also depends on how much you sell online: three returns on 44 online units is 6.8%, and it measures nothing. To make a claim about fit you need evidence that fit was tested. That means a fit session, or size-level sell-through with the sold-out sizes marked as censored, or return reasons in usable numbers. Absence of a complaint is absence of data, not proof of a pass.