Lessons · Lesson 1 of 3
Units, weeks, and the rate at which a thing sells
Read a weekly trading sheet the way a planner has to: rate of sale, sell-through with its week attached, and cover measured against the weeks that are left.
Lesson 1 of 3 · 42 min
The situation
Every shop keeps a weekly record: what it owns, what came in, what went out. Most arguments in a retail business are fought with the few figures worked out from that record. This lesson reads them with you. It also covers the correction for goods that come back through the post.
Two products can be leaving the shop at exactly the same speed. One is about to run out. The other is about to be left over. Only one figure on the page can tell them apart.
It is Monday 23 March 2026, in the jersey office at Marchwood in Oswestry. Marchwood sells womenswear jersey and very little else: T-shirts, vests, long-sleeve tops, the plain and printed cotton things a customer buys three of. Fifty-four shops and a website.
Two people share the spring season. Nadine Selby buys the product and agrees the price. Fenella Kettleby is the retail merchandiser. That is the planning job: the budget, the weekly numbers, the intake, the markdown. In UK and European retail these are two separate roles, judged on different halves of the same season. (On the supply side, a merchandiser is the person who runs an order inside a factory. That is track 27's sense of the word. This track always means the retail one.)
It is week 8 of a 26-week season. Week 1 was the week starting Monday 2 February 2026. Week 26 ends on Sunday 2 August. Jersey tops sell at full price for the first twenty weeks, and that window closes on Sunday 21 June. Weeks 21 to 26 are the summer sale.
Two styles on Fenella's sheet this morning landed together in week 1.
| MWD-2214 | MWD-2260 | |
|---|---|---|
| What it is | striped jersey tee | printed jersey tee |
| Ticket price | GBP 22.00 | GBP 16.00 |
| Landed cost a unit | GBP 6.05 | GBP 4.72 |
| Units received, week 1 | 9,600 | 18,000 |
| Made by | Aviyur Knits, Coimbatore | Aviyur Knits, Coimbatore |
By the end of the season one of these two styles will have made GBP 111,843 of gross margin on 9,600 units. The other will have made GBP 103,710 on 18,000 units. One is the best thing Marchwood bought all spring. The other is the worst. Both are already going wrong on this morning's sheet, in opposite directions — and the number that says so is not the one anybody is looking at.
This lesson is the four numbers on that sheet, and how to read them. Lesson 2 turns them into money. Lesson 3 asks where the decision was really made.
Four numbers, and only one of them has time in it
Everything a planner reads each week is built from three raw counts — stock, sales, intake — and one identity that ties them together:
closing stock = opening stock + intake − sales + returnsThat is not a model. It is bookkeeping. A unit is either still here, or it went out, or it came back. Every weekly sheet in retail is that one line repeated. So the first thing to do with an unfamiliar sheet is check that it closes.
| Week | Opening | Intake | Sold | Returned | Closing |
|---|---|---|---|---|---|
| 1 | 0 | 9,600 | 620 | 0 | 8,980 |
| 2 | 8,980 | 0 | 700 | 34 | 8,314 |
| 3 | 8,314 | 0 | 740 | 58 | 7,632 |
| 4 | 7,632 | 0 | 772 | 66 | 6,926 |
From those counts come the three derived numbers a planner actually argues about.
Rate of sale is units sold per week. Always say which weeks you measured. A rate of sale is an average over a stretch of weeks, and the stretch changes the answer. MWD-2214 averaged 708 a week over weeks 1 to 4, and 720 a week over weeks 5 to 8. Marchwood reads the last four weeks. A rate of sale is being used to say something about next week, and a fourteen-week average buries what the style is doing now.
A whole-chain figure is no use for comparing your business with anyone else's, so it is usually divided down. Of Marchwood's jersey units, 74% go through the shops and 26% through the website, and there are 54 shops. MWD-2214's last four weeks work out at 9.9 units a shop a week.
Sell-through is the share of what you received that has gone:
sell-through % = units sold ÷ units received × 100Always say the week. "Sell-through of 59.5%" is not a fact about a style. It is a fact about a style at a moment. The same 59.5% is a triumph in week 4 and a disaster in week 18. A sell-through quoted without its week is the commonest way a retail conversation goes wrong.
Cover is the number with time in it. It is the one this lesson exists for:
weeks of cover = closing stock ÷ the weekly rate of sale expected aheadCover turns a pile of units into a number of weeks. It answers the only question that matters in week 8 — how long will this last? It is the number that turns a stock figure into a decision.
The week 8 sheet
Here are the two styles side by side, as the sheet showed them.
| MWD-2214 | MWD-2260 | |
|---|---|---|
| Received | 9,600 | 18,000 |
| Sold, weeks 1 to 8 | 5,712 | 5,688 |
| Rate of sale, last four weeks | 720 a week | 716 a week |
| Rate of sale a shop a week | 9.9 | 9.8 |
| Sell-through at week 8 | 59.5% | 31.6% |
| Stock on hand | 3,888 | 12,312 |
| Weeks of cover | 5.4 | 17.2 |
| Weeks of full-price window left | 12 | 12 |
Read the rate of sale row first, because it should surprise you. These two styles are selling at the same speed. Not similar. The same, to within four units a week and a tenth of a unit a shop. The same number of customers are walking out with each of them.
Now read the cover row. MWD-2214 has 5.4 weeks of stock and 12 weeks of selling left. It runs out around week 14, and then there are six weeks of full-price window with nothing on the rail. MWD-2260 has 17.2 weeks of stock and 12 weeks of selling left. At this rate it cannot finish, and about 3,700 units will still be there when the window shuts. A style's rate of sale falls as it ages, so the real figure turns out worse than that.
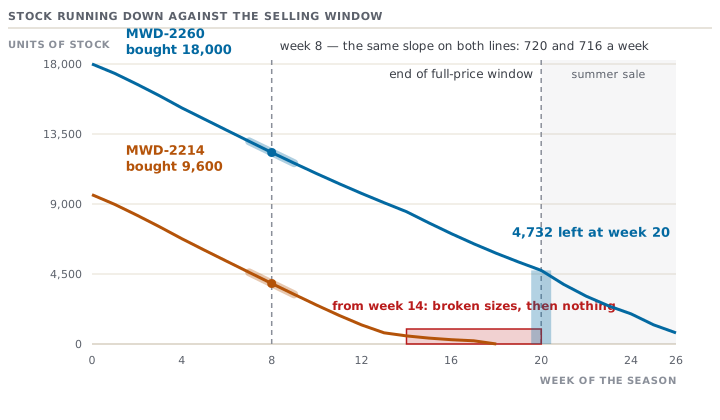
Nothing about the customer separates these two lines. What separates them is how deep each was bought, and cover is the only number on the sheet that can see it. Sell-through cannot: 59.5% and 31.6% look like a strong style and a slow one, which is the wrong diagnosis for both. Rate of sale cannot: it is identical. The buy depth is invisible in every number except the one that divides stock by speed.
The correction the sheet has not made: returns
That sheet counts units through the till. Some of them come back.
Marchwood measures its own return rate on jersey tops. That is the only figure that is any use, because the rate depends on the product, the fit, the photography and the channel. A borrowed number is worse than none. On this class the rate is 22% of online units and 5% of shop units. With 26% of sales online, that blends to 9.42% overall.
Returns matter to a planner for a mechanical reason, not a moral one: a returned unit goes back into stock, so it can be sold again, and it was never really sold the first time. Both sides of the identity move.
| MWD-2214 | MWD-2260 | |
|---|---|---|
| Sold through the till | 5,712 | 5,688 |
| Returns received by week 8 | 486 | 482 |
| Net units sold | 5,226 | 5,206 |
| Net sell-through | 54.4% | 28.9% |
| Closing stock, with returns back in | 4,374 | 12,794 |
| Net rate of sale, last four weeks | 638 | 634 |
| Net weeks of cover | 6.9 | 20.2 |
Three things are worth taking from that table.
The correction is real, and it is not small. MWD-2214's sell-through drops by 5.1 percentage points, and its cover rises by a week and a half. On a style being argued about in a meeting, that is the difference between two sentences.
It does not change either verdict. 6.9 weeks against 12 is still a stockout. 20.2 weeks against 12 is still a markdown. When a correction moves the number but not the decision, say so out loud. It stops the meeting arguing about the arithmetic instead of the problem.
The returns figure at week 8 is itself understated, and that is not an error. 486 returns on 5,712 sales is 8.5%, against a measured rate of 9.42%. A garment sold in week 7 comes back in week 8 or 9. So early in a season, the returns received always lag the returns earned. The gap closes as the season matures. Across the whole of MWD-2214's spring, the till will ring up about 10,371 sales, 977 units will come back, and 9,394 will stay sold.
What the sheet could not tell anybody
Both problems were on this page in week 8, and both had been on it earlier. MWD-2260's cover in week 3 was 23.5 weeks against 17 weeks of window. It was already unfinishable when it had sold 2,040 units.
Fenella can act on one of them. Stock can be moved between shops, a markdown can be brought forward, a style can be pushed harder online. She cannot act on the other, and this is the part that makes retail planning what it is. Marchwood's order lead time with Aviyur Knits is sixteen weeks. An order placed today lands in week 24, four weeks after the full-price window has shut. The buy quantities for spring 2026 were committed on Monday 13 October 2025. That is sixteen weeks before a single one of these units was on sale, and before any of the evidence on this sheet existed.
So the honest description of MWD-2214 is not "it is selling well". It is this: a decision taken in October was wrong by about a third, the sheet could have said so by week 8, and nothing anyone does in week 8 can fetch the units. Lesson 3 puts a number on that. This lesson's job was the reading.
Check yourselfA style has 42% sell-through. Is that good?Show the answer
The question cannot be answered, and refusing to answer it is the skill. 42% at week 4 of a 20-week window, with 8 weeks of cover, is a style that will finish clean and probably wants more units. 42% at week 16, with 14 weeks of cover, is a markdown you have not taken yet. Sell-through carries no time in it. It tells you how much of the buy has gone, never whether it went fast enough. Ask two things before you answer — which week and how many weeks of cover — and you will have diagnosed the style before anybody has finished quoting percentages at you.
Check yourselfTwo styles both show 9.9 units a shop a week. One has 6 weeks of cover, the other 20. Which one has the problem?Show the answer
Both, and they are not the same problem. That is why the pair is worth recognising on sight. An identical rate of sale means the customer likes them equally. The difference is entirely in how deep each was bought. Six weeks of cover with twelve weeks of window left is a stockout being built: the style will spend its best remaining weeks in broken sizes. Twenty weeks of cover with twelve weeks left is a markdown being built. The reflex worth having: when rate of sale is equal and cover is not, stop looking at the product and look at the quantity.
Prompt · Take one week of a trading sheet apart
When a weekly sheet is in front of you and you want the four numbers separated before anybody in the meeting forms an opinion.
Act as a retail merchandiser reading a weekly trading line. My figures, per week for the weeks I give you: opening stock, intake, units sold, units returned, closing stock. Style [CODE], units received to date [UNITS], ticket price [AMOUNT], the season week we are in now [NUMBER], the week the full-price window closes [NUMBER], my shop count [NUMBER], and my online share of units [PERCENTAGE]. My own measured return rate for this product class is [RATE] online and [RATE] in shop. If I have not given you one, ask for it and do NOT substitute an industry figure: a borrowed return rate is worse than none. Do the following, in this order. First, check that opening stock plus intake less sales plus returns equals closing stock for every week. If any week does not close, stop and tell me which one, because a sheet that does not close cannot be interpreted. Second, give me the rate of sale over the last four weeks and over the whole season to date, state both windows explicitly, and divide the recent one down to units per shop per week. Third, give me sell-through GROSS and NET of returns, and write the week number next to each. Never quote either without it. Fourth, work out weeks of cover on the closing stock, using the forward rate of sale I give you rather than the one you have just measured. If I have not given you one, ask, and say which you used. Fifth, put cover side by side with the weeks of full-price window remaining, and tell me in one sentence which of three states this style is in: it will finish clean, it will run out early, or it will not finish. Sixth, if it will not finish, tell me how many units are projected to be left when the window shuts, and say that this is the optimistic case, because rate of sale decays as a style ages. Do not recommend a markdown, do not recommend a repeat buy, and do not describe a style as strong or weak on sell-through alone.
AI can make mistakes — check anything you act on.
Where this goes next
You can now take a weekly sheet apart. Check that the stock identity closes. Work out a rate of sale over a stated window. Quote a sell-through with its week attached. Correct both for returns. Then divide stock by speed to get a cover figure, and read it against the calendar rather than against a feeling.
None of that is money yet. Lesson 2 puts a price on both styles: the markup a supplier quotes against the margin a retailer books, and the ticket price a target margin implies. It also gives you the single most useful number a planner can hand a buyer — the full-price sell-through this style has to hit before the plan is true.