Lessons · Lesson 3 of 3
Reforecasting: is the season smaller, or is it late?
Read four weeks of trade against a plan, separate a season that shrank from a season that moved, and size the intake decision each reading implies.
Lesson 3 of 3 · 39 min
The situation
A few weeks into a season, the sales are behind the plan. Only two stories fit. Either fewer people want the product than anybody thought, or the same people have not come in yet. The two call for opposite actions: one cancels orders, the other leaves them alone. This lesson is how to tell them apart while it still matters.
Monday 22 September 2025, the end of retail week 4. Stanmere's kidswear outerwear has traded four weeks against the plan built in lesson 1, and the weekly file says this:
5,267 units sold against 6,052 planned. 87.0% of plan.
The instinct in the room is immediate, and it is not stupid: the season is smaller than we thought, cut the intake. Somebody has already done the arithmetic on the back of the pack.
The level reading, in full, because it is the one to beat
Take the index the first four weeks produced — actual divided by plan — and apply it to everything ahead:
index          = 5,267 / 6,052 = 0.8703
remaining plan = 47,800 - 6,052 = 41,748
remaining      = 41,748 x 0.8703 = 36,333
season         = 5,267 + 36,333 = 41,600 units, or minus 13.0%
This is a reading, not a calculation, and the difference matters. The arithmetic is trivially right. What it assumes is that the shortfall is proportional and permanent: whatever held back weeks 1 to 4 will hold back weeks 5 to 18 by the same fraction, and nothing that failed to sell in September will sell in November instead.
Those are two large assumptions about a category whose demand is set off by the weather. Neither is tested by the number that produced them.
Split the shortfall before you reforecast it
Stanmere's outerwear range is six options in two families, and the families exist because they sell for different reasons. Mid-weight is bought against the school term: a child needs a coat in September whatever the temperature. Padded is bought against the first cold: nobody buys an insulated parka to be ready.
| Option | Description | Retail | Family | Plan | Actual | Index |
|---|---|---|---|---|---|---|
| SM-2210 | Showerproof school mac | GBP 26.00 | Mid-weight | 2,180 | 2,164 | 99.3% |
| SM-2214 | Fleece-lined windbreaker | GBP 30.00 | Mid-weight | 1,610 | 1,528 | 94.9% |
| SM-2231 | Quilted gilet | GBP 24.00 | Mid-weight | 1,124 | 1,086 | 96.6% |
| SM-2248 | Padded jacket | GBP 38.00 | Padded | 604 | 281 | 46.5% |
| SM-2255 | Hooded parka | GBP 46.00 | Padded | 361 | 148 | 41.0% |
| SM-2262 | Longline padded coat | GBP 52.00 | Padded | 173 | 60 | 34.7% |
| Family | Plan | Actual | Index | Share of the shortfall |
|---|---|---|---|---|
| Mid-weight | 4,914 | 4,778 | 97.2% | 17.3% |
| Padded | 1,138 | 489 | 43.0% | 82.7% |
| Category | 6,052 | 5,267 | 87.0% | — |
The mid-weight half of the range is on plan. Not roughly on plan: 97.2%, which for four weeks of a kidswear category is noise. The customer is coming into the shops, and she is buying. The whole deficit, 649 units of a 785-unit shortfall, sits in the half of the range that needs cold weather to sell.
And inside the padded family the shortfalls are ordered: 46.5%, 41.0%, 34.7%, from the lightest padded jacket, through the parka, to the longline coat. The warmer the garment, the worse it did. That order is the thing to notice, because a general collapse in demand has no reason to sort itself by how much insulation a coat carries. A temperature explanation predicts exactly that order before you look at it, and the order is there.
One more reading, from Stanmere's own record. The average daytime high across its four largest catchment areas over weeks 1 to 4 was 19.4 degrees this year against 15.8 in the same calendar weeks last year, 3.6 warmer.
The second reading: the season is late
If the trigger has not fired, the demand has not gone. It has moved. Model that as simply as it can be modelled: the padded curve happens two weeks later than planned, and the mid-weight curve happens as planned.
The useful thing about that model is that it makes a prediction about data already in the file. Under a two-week lag, padded sales in weeks 1 to 4 should look like the planned padded weeks that come before them: nothing, nothing, then weeks 1 and 2. That is 0, 0, 112 and 259, a total of 371 units. Actual padded was 41, 66, 138 and 244: 489 units.
The model predicts 118 units too few, and almost all of that sits in weeks 1 and 2, where its floor of zero is obviously too crude. It never predicts too many. That is support, and it is worth having, but be clear about its weight. It is a four-point fit on a model with a lag somebody chose, produced by somebody who wanted it to work. It is evidence that the lag reading is available, not evidence that it is right.
Writing the reforecast
Three rules, and the third is the one that gets forgotten.
- Mid-weight carries forward at its measured index, 97.2%. Four weeks of on-trend data is the best estimate available of the weeks ahead.
- Padded is lagged two weeks: week 5 receives the plan's week 3, week 6 the plan's week 4, and so on.
- The school holiday does not lag. Week 10's plan of 4,109 units is 3,184 of underlying trend plus 925 of October break, and the break is on 27 October whatever the weather does. So the uplift is taken out of the curve before the lag is applied and put back into week 10 afterwards: 536 units of it padded, 389 mid-weight. You cannot move a school holiday two weeks later because it is cold.
| Week | Plan | Level reading | Calendar-lag reading |
|---|---|---|---|
| 5 | 1,870 | 1,627 | 1,634 |
| 6 | 2,249 | 1,957 | 1,805 |
| 7 | 2,585 | 2,250 | 2,019 |
| 8 | 2,827 | 2,460 | 2,239 |
| 9 | 3,026 | 2,634 | 2,439 |
| 10 | 4,109 | 3,576 | 3,582 |
| 11 | 3,341 | 2,908 | 2,869 |
| 12 | 3,510 | 3,055 | 3,007 |
| 13 | 3,699 | 3,219 | 3,150 |
| 14 | 3,951 | 3,439 | 3,392 |
| 15 | 3,583 | 3,118 | 3,495 |
| 16 | 3,205 | 2,789 | 3,655 |
| 17 | 2,606 | 2,268 | 3,361 |
| 18 | 1,187 | 1,033 | 2,741 |
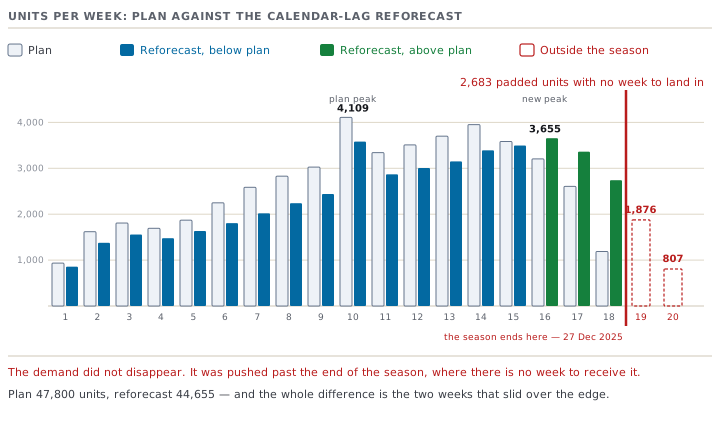
Season totals: 41,600 units on the level reading and 44,655 on the lag reading, a gap of 3,055.
The tail falls off the edge, and that is where the loss is
A late season is not a costless season, and the diagram shows why. Lag the padded curve two weeks and its last two planned weeks — 1,876 and 807 units — are pushed into weeks 19 and 20. There is no week 19. The season closes on Saturday 27 December.
2,683 padded units, GBP 30,586.20 at cost, are lost. Not because anybody stopped wanting them, but because the calendar ran out. That is the whole loss in the lag reading: minus 6.6% against a plan whose customer never went anywhere. A late season loses its tail, every time, and the amount it loses is decided by how close the peak sat to the end before it moved.
The finding that decides how you work for the next month
Look again at the two reforecast columns, week by week rather than in total.
- Over weeks 5 to 14 — the ten weeks in which every remaining intake decision has to be taken — the two readings differ by 989 units, under 4% of either. Week 10 differs by 6 units.
- Over weeks 15 to 18 they differ by 4,044 units in the other direction.
The category total cannot tell these two readings apart until the last four weeks of the season, which is after every decision that depends on the answer has been taken. Watching the category number and waiting for clarity is the same thing as choosing the level reading by default.
The padded sub-total can tell them apart straight away:
- Padded units, weeks 5 to 8, on the level reading: 3,319.
- Padded units, weeks 5 to 8, on the lag reading: 2,138.
Those differ by 55.2%. Four weeks of one sub-total, read off the same weekly file everyone already has, settles a question the headline number will still be hiding at Christmas.
The intake decision
At the end of week 4, of 47,200 units of planned intake:
- Deliveries 1 and 2 have landed. 17,600 units, gone.
- Delivery 3 is on the water for week 7. 11,600 units, fixed.
- Deliveries 4 and 5 are still in production at Marram, Stanmere's padded-outerwear maker. 18,000 units, movable. Marram's cut-off for a change is six weeks before the delivery week.
So 61.9% of the intake is already decided, and the reforecast can only be acted on through the remaining 18,000.
| Delivery | Planned week | Planned units | Revised week | Revised units |
|---|---|---|---|---|
| 1 | 1 | 7,400 | 1 | 7,400 |
| 2 | 4 | 10,200 | 4 | 10,200 |
| 3 | 7 | 11,600 | 7 | 11,600 |
| 4 | 10 | 10,800 | 11 | 8,600 |
| 5 | 13 | 7,200 | 14 | 5,800 |
Three decisions, each with its reason.
Cut 3,600 units, 20.0% of what is still movable. Under the lag reading the season closes on 5,745 units against a plan of 6,200 — slightly tight, deliberately. Under the level reading it closes on 8,800, which is too much, and that is the exposure being carried on purpose.
Move delivery 4 from week 10 to week 11. The padded demand it is for has moved, so the stock should move with it. The reason this is affordable rather than brave is a number: without that delivery, week 10 still closes on 5.5 weeks of cover, inside Stanmere's band. The October break in week 10 is a mid-weight week as much as a padded one, and the mid-weight stock is already in the building.
Book delivery 5 at 5,800 for week 14, and hold the final quantity until week 8. Marram's cut-off is six weeks out, so the last honest moment to size it is the end of week 8 — which is exactly when the padded sub-total for weeks 5 to 8 will be readable. If padded lands near 2,138, the lag reading holds and 5,800 is right. If it lands near 3,319, the level reading was right all along, delivery 5 falls to 3,600, and the season closes on 6,600. The decision is not being put off. The decision is being made now, in the form of what will settle it and when.
Prompt · Is the season smaller, or is it late? Write it both ways
The morning a category comes in under plan and somebody proposes cutting the intake.
Act as two planners arguing opposite readings of the same weeks, and give me both cases in full before you choose one. Weeks traded so far: [NUMBER]. Plan and actual by week for those weeks. The rest of the plan by week. Split the range into groups that sell for DIFFERENT REASONS and give plan and actual for each group over the traded weeks: [FOR EXAMPLE, BOUGHT AGAINST A TERM OR AN OCCASION VERSUS BOUGHT AGAINST THE WEATHER — AND SAY WHICH OPTION IS IN WHICH GROUP AND WHY]. Option-level plan and actual for the traded weeks. Any dated driver still ahead of us, with its week number. Any measurement I hold that could explain a trigger not firing: [TEMPERATURE, FOOTFALL, WEB SESSIONS — MY OWN RECORDS ONLY]. Intake position: [FOR EACH DELIVERY, THE WEEK, THE UNITS, WHETHER IT HAS LANDED, WHETHER IT IS IN TRANSIT, AND THE LAST DATE ITS QUANTITY CAN BE CHANGED]. Landed cost per unit. Do the following. First, write the LEVEL reading: one index from the traded weeks applied to everything ahead, with the season total and the variance, and state in one sentence what it assumes. Second, write the SHAPE reading: which group has moved and by how many weeks, fitted so that it makes a prediction about the weeks already traded, and tell me honestly how well that prediction did, and how much weight four data points can carry. Third, in the shape reading, hold every CALENDAR-FIXED driver in its own week and say which ones you held and why — a holiday does not move because the weather did. Fourth, tell me how much demand the shape reading pushes past the last week of the season, in units and at cost, because that is the loss in a season that is merely late. Fifth, and most important, compare the two readings week by week: tell me in which weeks they differ by less than five per cent, in which weeks they diverge, and whether the category total can distinguish them before my last intake decision. Then name the SUB-TOTAL that can, give me the two numbers it should show under each reading, and the week I should read it. Sixth, give me the intake decision as lines: what is already committed and unchangeable, what is still movable, what to cut, what to move, what to book with a decision held open, and the date that decision has to be taken. State the reforecast as a range, not a number, and say which end you trust and why.
AI can make mistakes — check anything you act on.
What this course leaves you with
- A phased plan is built against a calendar, not against a column of week numbers, and the two disagree whenever a retail year holds a 53rd week.
- Intake is phased ahead of sales by the cover you have chosen to hold. That is why the buying calendar runs weeks in front of the selling calendar, and why an intake decision is always taken against a forecast nobody has been able to check yet.
- A shortfall is either level or shape. The two look almost identical in a category total for ten weeks, and the sub-total that separates them is usually already in the file.
- A late season loses its tail at the season boundary. That loss is the reason lateness costs money at all, and it is the one number a reforecast should always show.
What to do with 6,200 units of end-of-season stock, when to take the first markdown and what it does to achieved margin, is course 17.4. What the reforecast does to the money still available to commit is 17.2's open-to-buy, which moves the moment this reforecast is signed.
Check yourselfFour weeks in, your category is at 87% of plan. Before you reforecast, what is the single most useful thing to split the number by, and why that rather than by store or by size?Show the answer
Split it by whatever divides the range into groups that sell for DIFFERENT REASONS — here, garments bought against the school term versus garments bought against the weather. That split is the only one that can tell a smaller season from a later one, because a collapse in demand hits both halves and a trigger that has not fired hits only one. Store and size splits are useful for other questions and cannot answer this one: a warm September is warm in every shop and in every size, so both splits will show the shortfall spread evenly and you will learn nothing. Suppose the split by reason shows one half on plan and the other half at 43%, and the shortfalls inside that half get worse as the garments get warmer. Then you have positive evidence of a trigger that has not fired, rather than an absence of evidence of anything else.
Check yourselfYour reforecast says the season is late rather than small, so the units will come back. Why is the season still smaller than plan, and by how much?Show the answer
Because a season has an end date, and demand pushed past it does not arrive. Lag a curve by two weeks and the two weeks of demand planned for the final fortnight now fall into weeks that do not exist. At Stanmere that is 1,876 plus 807, which is 2,683 padded units, GBP 30,586.20 at cost. That is the entire difference between a late season and a normal one in the lag reading, and it is why lateness is expensive even when nobody stopped wanting the product. It also tells you where the exposure is worst: the closer a category's peak sits to the end of its season, the more of it a delay pushes over the edge. And it is a floor rather than a full answer, because the last weeks of a lagged curve land on the weeks a season trades worst. Week 18 here has four selling days and Christmas Day in it, and cannot absorb a peak-shaped week.