Lessons · Lesson 1 of 3
Last year's shape, this year's calendar
Turn a season total into a weekly plan by matching last year's trade to this year's dates, and see what a one-week slip costs.
Lesson 1 of 3 · 41 min
The situation
A season budget is one number. You cannot manage one number. Before anybody can say in October how a range is selling, that number has to be spread across the weeks. More in the busy weeks, less in the quiet ones. Spreading it out like that is called phasing. The usual way to do it is to copy the shape of the same season last year. This lesson does exactly that, and then shows the trap inside it. Shops count time in numbered weeks rather than in dates, and the two drift apart.
Wednesday 11 June 2025, the planning office at Stanmere, a kidswear chain with 54 shops and a website. The autumn-winter outerwear range was signed off two weeks ago: six options, a season total, an intake budget. What is due on Friday is the thing nobody argues about in a range meeting and everybody quotes for the next five months — the phased plan. One number per week, from the first week of the season to the last.
The planner has last year's weekly sales file open and a season total on a sticky note. The obvious method is the right method: last year's shape, this year's size. It takes twenty minutes. It also produces a plan that is wrong by 7,730 units — 16.2% of the season, spread over eighteen weeks in a pattern nobody would ever spot by looking at it.
Nobody makes a mistake in this lesson. The arithmetic is right all the way through. What moved was the calendar.
Conventions, settled once
Everything below is in units, meaning pieces. Outerwear is bought, shipped, sent to shops and counted in pieces. And a phasing argument held in money hides a change of mix inside the total. Where money does appear it is at cost — what the goods cost Stanmere once delivered — and the text says so. Stanmere also keeps a money WSSI (a weekly sheet of sales, stock and intake) at selling prices. This course does not use it. Course 17.2 does.
A selling point is one shop, or the website. Stanmere traded 53 of them last year and trades 55 this year. Rate of sale is units sold per selling point per week. It is measured from the weekly file, never guessed from a total, which is the whole reason the shop count above matters.
Stanmere's outerwear season opens on the Sunday that starts its retail month 7, and closes on the last Saturday of December. Its retail week runs Sunday to Saturday.
Step one: the total, which is already three different numbers
The range meeting agreed a season plan of 47,800 units. Against what?
| Base | Units | Weeks | Plan against it |
|---|---|---|---|
| Last season as reported | 46,110 | 19 | plus 3.7% |
| Last season, comparable weeks only | 45,490 | 18 | plus 5.1% |
| Comparable weeks, per selling point | 858.30 | 18 | plus 1.3% |
Three correct answers to one question. Last season ran nineteen weeks and this one runs eighteen, so the reported total contains a week this season does not have. And the chain grew by two selling points, so part of what is left is not growth at all. It is two more shops.
The per-selling-point line is the one to keep. 47,800 across 55 selling points is 869.09 units each. 45,490 across 53 was 858.30. A plan the buying team calls a 3.7% increase asks each existing shop to sell 1.3% more. Both sentences are true. Only one of them is a target anybody can hit or miss.
Step two: last year's shape
| Week | Week commencing | Units |
|---|---|---|
| 1 | 18 Aug 2024 | 620 |
| 2 | 25 Aug 2024 | 890 |
| 3 | 1 Sep 2024 | 1,540 |
| 4 | 8 Sep 2024 | 1,720 |
| 5 | 15 Sep 2024 | 1,610 |
| 6 | 22 Sep 2024 | 1,780 |
| 7 | 29 Sep 2024 | 2,140 |
| 8 | 6 Oct 2024 | 2,460 |
| 9 | 13 Oct 2024 | 2,690 |
| 10 | 20 Oct 2024 | 2,880 |
| 11 | 27 Oct 2024 | 3,910 |
| 12 | 3 Nov 2024 | 3,180 |
| 13 | 10 Nov 2024 | 3,340 |
| 14 | 17 Nov 2024 | 3,520 |
| 15 | 24 Nov 2024 | 3,760 |
| 16 | 1 Dec 2024 | 3,410 |
| 17 | 8 Dec 2024 | 3,050 |
| 18 | 15 Dec 2024 | 2,480 |
| 19 | 22 Dec 2024 | 1,130 |
Read week 11 against the weeks on either side of it. Week 10 sold 2,880 and week 12 sold 3,180. Week 11 sold 3,910. Take the midpoint of its two neighbours as the underlying trend and you get 3,030. So 880 units of week 11 are an event, not a trend. The event is the October school break, which began across Stanmere's areas on Monday 28 October 2024. It is the biggest single week of the outerwear season, and it is fixed to the calendar, not to the retail week number.
Step three: the obvious phasing, which is where the trouble is
Eighteen weeks this year, nineteen last. The planner drops last year's final week — the season is a week shorter, and the last week was the smallest — rescales the remaining eighteen weekly shares so they still add up to the whole season, and multiplies by 47,800.
That is a defensible thing to do, and it is what almost everybody does. It also quietly claims something: that this year's week 5 is last year's week 5. Nobody would say that out loud, because said out loud it is obviously a question rather than an assumption.
Step four: ask the question out loud
Stanmere's retail year 2024 held fifty-three weeks. A retail year of 52 weeks is 364 days, and a 53-week year is 371. So a season that opens in the same retail week opens six days later in the calendar than it did the year before. Last season opened Sunday 18 August 2024. This one opens Sunday 24 August 2025 — 371 days later.
The close does not move with it. Both seasons end on the last Saturday of December: 28 December 2024 and 27 December 2025. A start that slipped six days later, and an end that did not slip, is a season one week shorter. That is where the nineteenth week went. It was not dropped from the end. It fell off the front.
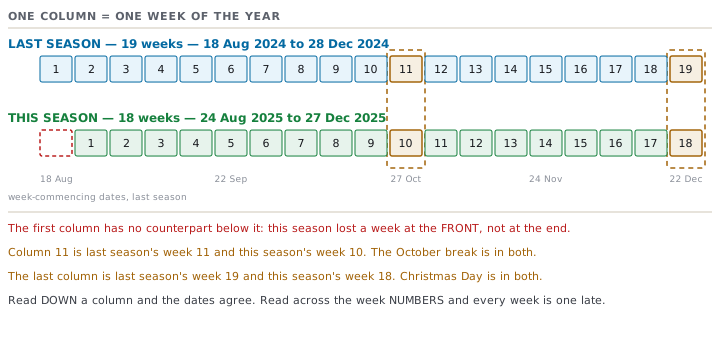
Line the two seasons up by date and the match is exact to within a day:
- This year's week 1 (24 to 30 August 2025) covers the same calendar days as last year's week 2 (25 to 31 August 2024).
- Every week this year matches last year's week with the next number up, all the way through.
- Last year's week 1 (18 to 24 August 2024) has no match at all. That is the week this season does not have.
- The October break fell in last year's week 11 and falls in this year's week 10 — Monday 27 October 2025.
- Christmas Day fell in last year's week 19 and falls in this year's week 18.
So the comparable base is last year's weeks 2 to 19, which is the 45,490 in the first table. The correct phasing gives each of those eighteen weeks to the week that shares its dates.
The two curves, side by side
| Week | Week commencing | By week number | By calendar | Difference |
|---|---|---|---|---|
| 1 | 24 Aug 2025 | 659 | 935 | plus 276 |
| 2 | 31 Aug 2025 | 946 | 1,618 | plus 672 |
| 3 | 7 Sep 2025 | 1,636 | 1,807 | plus 171 |
| 4 | 14 Sep 2025 | 1,828 | 1,692 | minus 136 |
| 5 | 21 Sep 2025 | 1,711 | 1,870 | plus 159 |
| 6 | 28 Sep 2025 | 1,892 | 2,249 | plus 357 |
| 7 | 5 Oct 2025 | 2,274 | 2,585 | plus 311 |
| 8 | 12 Oct 2025 | 2,614 | 2,827 | plus 213 |
| 9 | 19 Oct 2025 | 2,859 | 3,026 | plus 167 |
| 10 | 26 Oct 2025 | 3,061 | 4,109 | plus 1,048 |
| 11 | 2 Nov 2025 | 4,155 | 3,341 | minus 814 |
| 12 | 9 Nov 2025 | 3,379 | 3,510 | plus 131 |
| 13 | 16 Nov 2025 | 3,549 | 3,699 | plus 150 |
| 14 | 23 Nov 2025 | 3,741 | 3,951 | plus 210 |
| 15 | 30 Nov 2025 | 3,996 | 3,583 | minus 413 |
| 16 | 7 Dec 2025 | 3,624 | 3,205 | minus 419 |
| 17 | 14 Dec 2025 | 3,241 | 2,606 | minus 635 |
| 18 | 21 Dec 2025 | 2,635 | 1,187 | minus 1,448 |
Both columns total 47,800. The season is the same size either way, which is exactly why nobody checks it: the number the finance director signed is untouched. Add the differences up and ignore the signs, and 7,730 units are in the wrong week — 16.2% of the season, in a plan whose total is perfect.
Two rows are worth reading twice. Week 10 is 1,048 units too low, because the school break is missing from it. The 880-unit event measured in last year's file, scaled up to this year's plan level by 47,800 divided by 45,490, which is 1.0508, is 925 units. The rest of the gap is the underlying curve being a week out. Week 18 is 1,448 too high, because the naive method gave Christmas week the shape of the week before Christmas. Week 18 contains Christmas Day, when the shops are shut, plus the four selling days around it.
Rate of sale: the number that is measured
A phased plan is a claim about how fast each shop sells, and that claim should be easy to read. Divide by selling points:
- Week 1 plans 17.0 units per selling point per week.
- Week 14 plans 71.8 units per selling point per week.
Those two numbers are worth more than the curve they came from, because a merchandiser can argue with them. Seventy-two coats a week through a small shop in late November is either normal for Stanmere or it is not, and the weekly file answers it. Nobody can argue with a season total. Every shop manager in the chain can argue with a weekly rate of sale, and that is the point.
Prompt · Phase a season against the calendar, not the week numbers
The week you have a season total and last year's weekly file, and a phased plan is due.
Act as a retail merchandiser who once copied last year's shape across by week number, got it badly wrong, and now refuses to do it again. Season being planned: [CATEGORY, TOTAL UNITS OR VALUE, AND SAY WHICH]. This season's opening and closing DATES and the number of weeks. Last season's opening and closing DATES and the number of weeks. Last season's actual units by week: [PASTE THE WHOLE FILE]. Selling points last season and this season: [NUMBERS, AND WHETHER THE WEBSITE COUNTS AS ONE]. Dated demand drivers in both years: [SCHOOL BREAKS, PUBLIC HOLIDAYS, PAY DATES, ANY EVENT FIXED TO A CALENDAR DATE — GIVE THE ACTUAL DATES]. Do the following. First, tell me whether the two seasons hold the same number of weeks, and if not, whether the difference is at the front or the back, and say what that means for which of last season's weeks are comparable at all. Second, build the mapping from each of this season's weeks to the week of last season that shares its calendar dates, and show it as a table with both sets of dates so I can check it by eye. Third, state my growth rate three ways — against last season as reported, against the comparable weeks only, and per selling point — and tell me which one is a target somebody can hit or miss. Fourth, phase the total twice, once by week number and once by calendar, put the two columns side by side with the difference, and give me the total absolute difference in units and as a percentage of the season. Fifth, for every dated driver, tell me which week number it fell in last season and which it falls in this season, and flag any week whose plan contains an event that is not happening in it. Sixth, express the peak week and one quiet week as a rate of sale per selling point per week, so somebody who runs a shop can argue with them. Do not smooth the curve, and do not present a single phasing as if it were the only one available.
AI can make mistakes — check anything you act on.
What this hands to lesson 2
A phased sales plan is not the output. It is the input to the intake plan. And the intake plan is where a phasing error stops being a reporting problem and starts costing money: stock arrives against the sales curve you drew, not the one the customer trades. A curve that is one week late orders stock one week late into a season with a hard peak.
That is next. What this lesson leaves settled is narrower, and worth stating plainly:
- The plan total is 47,800 units, which is plus 5.1% on the comparable eighteen weeks and plus 1.3% per selling point.
- The phasing is built by calendar date, not by retail week number, because the two disagree this year by a whole week.
- Week 10 is the biggest week of the season at 4,109 units, and 925 of them are a school holiday rather than a trend.
Check yourselfYour season is 18 weeks this year and was 19 last year, and the total is planned at plus 4%. Name the two questions you would ask before phasing anything.Show the answer
First: did the season lose the week at the front or at the back? A retail year with a 53rd week pushes the next year's weeks later in the calendar. So a season pinned to a fixed closing date loses its FIRST week, not its last. The shape to copy is last year's weeks 2 to 19, not weeks 1 to 18. Second: what is plus 4% measured against? A total that includes a week this year does not have is not a comparable base, and neither is one measured across a different number of selling points. Those two questions change the size of the plan and the shape of it separately, and either one on its own leaves you with a curve that is wrong for a reason you will never find during the season.
Check yourselfIn week 10 your outerwear category sells 27% more than plan, and in week 11 it sells 20% less. Trading calls it a strong half-term followed by a lull. What else could it be, and how would you tell in an afternoon?Show the answer
It could be that the plan put the school break in week 11 and the customer took it in week 10. In that case nothing happened at all, and the two weeks together are exactly on plan. You can tell in three steps. Add weeks 10 and 11 together and compare the pair against the same pair in the plan: a phasing error cancels out across the boundary, a real trading story does not. Then find the Monday the schools broke up this year and last year, and work out which retail week each one fell in. Then look at last year's week 11 against the midpoint of the weeks on either side of it. That gives you the size of the holiday effect in units, and you can see whether it matches the gap in front of you. If it does, the right action is to move the plan, not to react to the trade.