Lessons · Lesson 3 of 3
A scorecard that cannot be gamed
Find the buy that would actually have made the most money, and rebuild the measures and the targets so that February's decision would have shown it.
Lesson 3 of 3 · 38 min
First, the argument for the defence
Money a business decides not to spend is worth something. It is worth only as much as whatever it goes on to earn. Money that is never spent earns nothing at all. This lesson takes that defence seriously and prices it. Then it asks the question the two lessons before it did not. Of every possible size of order, which one would have brought in the most money?
Before rebuilding anything, take seriously the case Rosalind and Gareth would make, because it is a real one and half of it is right.
The department released money. Intake at cost fell from GBP 1,422,100 to GBP 991,410, so GBP 430,690 was never committed. Average stock held fell from GBP 678,080 to GBP 352,210, so GBP 325,870 of the company's money was not sitting in a warehouse and a stockroom for half a year. GMROI exists precisely to reward that, and it did.
So price it. Ashcombe's cost of money is 8.0% a year. Not holding GBP 325,870 for a twenty-six-week season is worth about GBP 13,035.
Against GBP 150,880 of gross margin. The released money would have had to earn a great deal more than a bank charge to be worth the trade — and here is the part that settles it: it did not earn anything, because it was not spent. The denim budget was simply underspent. Money released is only worth what its next use earns, and this money had no next use.
The buy that would actually have made the most money
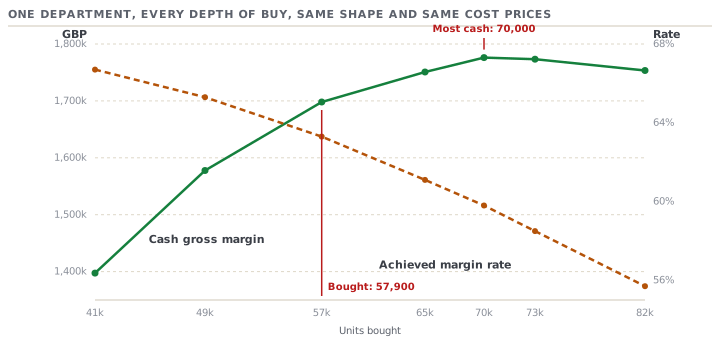
Run the same trading model across every possible depth, holding the shape and the cost prices constant. One row per buy, all six lines scaled together.
| Units bought | Achieved margin | Gross margin | GMROI |
|---|---|---|---|
| 82,000 | 55.7% | 1,753,370 | 2.6 |
| 73,800 | 58.5% | 1,773,211 | 3.2 |
| 70,000 | 59.8% | 1,776,092 | 3.6 |
| 65,600 | 61.1% | 1,750,798 | 4.0 |
| 57,900 | 63.3% | 1,698,126 | 5.1 |
| 49,200 | 65.3% | 1,577,724 | 6.8 |
| 41,000 | 66.7% | 1,397,369 | 9.5 |
Three shapes in one table, and they disagree with each other completely.
Achieved margin climbs all the way down. Every unit you do not buy is a unit that cannot be discounted, so the rate rises steadily as the buy shrinks, and never turns. There is no depth at which the rate says stop. Its best answer is a buy of nothing.
Gross margin is a hill. It rises to a peak at about 70,000 units — GBP 1,776,092, which is GBP 22,722 better than the 82,000 buy — and then falls away. There genuinely was a cut worth making last February. It was about 15%, and the department made one of 29%.
GMROI climbs all the way down too, and faster than anything else. From 2.6 to 9.5. Look at the bottom row: at 41,000 units the department would have posted a GMROI of 9.5, more than three times its target, on a gross margin GBP 378,723 below the peak. Its contribution would have been GBP 193,369 against the peak's GBP 572,092 — a third of the profit, on the best-looking scorecard in the table.
The same money, spent the other way round
Depth was only the smaller half. Take the buy Ashcombe actually made — 57,900 units, the same money — and spend it in the opposite shape. The jacket and the shirt are bought to the demand the previous season had already measured, and the four jeans are left as deep as the remaining budget allows.
| Bought as it was | Bought the other way round | |
|---|---|---|
| Intake margin | 67.3% | 67.5% |
| Achieved margin | 61.4% | 64.0% |
| Markdown | 7.0% | 9.2% |
| Sell-through | 90.2% | 99.3% |
| Stockturn | 2.8 | 3.0 |
| GMROI | 4.5 | 5.3 |
| Gross margin | 1,576,440 | 1,751,328 |
| Contribution | 372,440 | 547,328 |
GBP 174,888 more, on the same unit count and the same money. Five of the six measures are better as well.
The sixth is markdown, at 9.2% against 7.0% — because keeping the jeans deeper means selling more of them at a discount, which is the trade you want. And markdown was the number the whole exercise had been set up to fix.
That is what "individually green and collectively wrong" looks like at its sharpest. The better buy was available, it was better on almost every measure the department was managing, and the one measure it was worse on was the one the season had been organised around.
Three tests to apply to any measure before it becomes a target
The denominator test. Can this be improved by doing less of the business? Write down the bottom number of the ratio and ask what happens when it falls. Every measure in lesson 1 failed this test. That does not disqualify them — they are all useful. It disqualifies them as targets on their own.
The pairing test. For every rate, name the cash number that has to hold at the same time. For every cash number, name the money and the space it is allowed to consume. A target with no partner is an instruction to move in one direction until something breaks, and the thing that breaks will not be on the sheet.
The ownership test. Can one person move this alone? If two people can each move a measure by moving something the other owns, it will be improved twice and reconciled never. Ashcombe's repeat is the clean case. Two people refused the same order, each correctly, each for a different number, and no meeting ever took place in which both reasons were in the room. Give every measure one owner, and make any decision that moves two of them a decision two owners take together.
What Ashcombe's sheet is missing
Five additions, none of them exotic, all of them derivable from a file the department already keeps.
- Gross margin in cash, and contribution after the costs the buy does not change. These have no denominator, so nothing about trading less improves them. On Ashcombe's review they were the only two lines that told the truth.
- A lost-margin estimate, with its method agreed before the season. Lesson 2's GBP 230,976 is a model and will always be arguable. But a method fixed in advance and applied every season is wrong in the same direction every time, which is all a comparator needs to be. Agreeing it in February also stops it becoming an excuse invented in March.
- The money released, and where it went. One line, and it must name a destination. Released money with no destination is not a saving.
- Every rate shown beside its own top and bottom numbers. Sell-through of 90.2% is not a fact until 52,206 and 57,900 are printed next to it. This single formatting change would have made most of this course visible on one page.
- Terminal stock added to markdown, per line, in one column. Two names for one mistake, reported apart, is how the jacket survived a range review.
Setting a target that cannot be met by not trading
Lorna's February target was a rate: an achieved margin of 60.0%. It was met, by a margin, and it cost the department GBP 150,880.
Set the target on the pair instead: an achieved margin of at least 60.0%, at a gross margin of not less than last autumn's GBP 1,727,320. Now walk the depth table with both conditions in hand. The 57,900 buy fails, on cash. The 73,800 buy fails, on rate. The 65,600 buy passes both — 61.1% and GBP 1,750,798 — and would have produced GBP 174,358 more than the season actually did, before anything is done about the shape.
Two conditions, no new data, no new system. The rate target on its own picked a buy that was too small. The pair picks one that is nearly right, because the two conditions pull in opposite directions and the answer sits where they meet. It does not land exactly on the peak: the 70,000 buy that made the most cash misses the rate condition by two tenths of a point. That is the right kind of imprecision. A target is a limit on a decision, not a machine for finding the best one. What it has to do is put the wrong end of the range out of reach, and this one does.
You cannot look up what good is, and that is not a gap in this course
Every measure in this course has been compared to two things: the same department last autumn, and the plan it was set in February. Neither is an industry figure, and that is deliberate.
There is no trustworthy published benchmark for apparel sell-through, markdown percentage, stockturn or GMROI. Figures circulate — a sell-through that "should" be in a certain band, a full-price sell-through said to have fallen to a particular level, a markdown ladder described as best practice. Follow them back and they arrive at a software vendor's marketing page or a consultancy's blog, citing each other. None of it is original research. None of it is dated. None of it says which retailers, which categories or which definitions.
That matters more than it sounds, because these ratios cannot be compared between businesses, even when they are honestly measured. Ashcombe's markdown percentage is calculated on units sold. Another retailer puts its clearance sales in the same line and would post a very different number on identical trading. Ashcombe's stockturn is measured against an average of twenty-six weekly balances. A company that averages opening and closing stock will post a different figure on the same warehouse. Change the price structure, the store count, the markdown calendar or the season length, and every ratio here moves by more than any real difference in skill would.
So a borrowed benchmark is worse than no benchmark, because it looks like evidence. Three comparators are honest, and you have all three:
- Your own previous period, comparing like with like, with the definitions unchanged.
- Your own plan, set before the season and not moved afterwards — which is the whole reason it must be set before the season.
- The alternative uses of the same money in the same season, which is the comparison GMROI was built for and the only one that answers "should we have bought this at all".
If you want a number for what good looks like, derive it from your own plan the way lesson 1 derived everything else, and then defend it in the room where the buy is decided.
Check yourselfYour GMROI has gone from 3.1 to 4.4 and your cash gross margin is flat. What happened, and is it good?Show the answer
Average stock fell by roughly a third and the margin it produced did not change, so the same money is being made on much less stock. On its own that is genuinely good, but it is only banked if the released money went somewhere. Ask for the cash: what was the average stock in money, what is it now, what was bought with the difference, and what did that earn? If the answer is that the budget was underspent, the company has improved a ratio and earned a bank charge. If the answer names another department, another line or a repeat, the improvement is real and should be repeated next season.
Check yourselfA planner proposes a target of 'markdown below 8%'. What single change makes it a safe target?Show the answer
Pair it with a cash floor and a stock-cover condition, so it cannot be met by owning too little. That means markdown below 8.0% at a gross margin of not less than a stated amount, with the department in stock on its top lines to a stated week. Markdown percentage is a ratio whose bottom number is what you sold. So it improves whenever you have nothing to discount, and left alone its best answer is a department that sells out in week 12 and then trades on empty rails. On its own it is not a bad measure. As a solitary target it is an instruction to run out of stock.
Prompt · Turn my targets into pairs
When next season's targets are being set, before they are agreed.
Here are the targets proposed for my department next season, and last season's actuals for each.

[PASTE THE TARGETS AND THE ACTUALS]

For each target:

1. Say whether it is a ratio. If it is, name its bottom number and describe, in one sentence, the smallest action that would hit the target while making the department worse off.
2. Propose the paired condition that closes that route — a cash floor for a rate, a money-and-space limit for a cash amount, a stock-cover condition for a stock measure. Give the pair as a single sentence a director could read out.
3. Name the one person who owns the measure. If two people can move it by moving something the other owns, say so, and propose which decisions the two of them have to take together.

Then list any measure I have proposed that has no bottom number at all, and tell me whether my set contains at least one. If it does not, say so first and plainly, because a set of ratios with no cash line in it can all improve while the department shrinks.

Do not invent an industry benchmark for any of these, and if I have quoted one, ask me where it came from.
AI can make mistakes — check anything you act on.
What you can do now
- Derive a full KPI set from one trading file — intake, achieved and markdown percentages, sell-through, full-price sell-through, stockturn and GMROI — and reconcile every one of them to the same units and the same money.
- Split GMROI into its two halves — the achieved margin rate and the ratio of income to average stock — and say which half moved.
- Apply the denominator test to any measure put in front of you, and read a report ranked by money as the size chart it is.
- Build a margin bridge that separates cost, depth and shape, and know which of the three the argument in the room is actually about.
- Price a refusal — an order not placed, a repeat declined — at the price step the units would really have reached, and put the estimate's method in writing before the season rather than after it.
- Set a paired target, a rate with a cash floor, and test it against a depth table before agreeing to it.
And one thing that is not a calculation. When a review is entirely green and the business feels smaller, the measures are not lying to you and nobody in the room is either. They are all ratios, they all share a denominator called size, and the only way to see it is to put a number with no denominator on the same page.