Lessons · Lesson 1 of 3
The season that beat every target
Derive a whole retail KPI set from one season's trading data, watch every measure improve, and find the money that left anyway.
Lesson 1 of 3 · 42 min
The situation
A business measures itself with a handful of ratios. A ratio can be made to look better in two ways. Improve the thing on top, or shrink the thing underneath. This lesson works a whole set of them out from scratch, line by line. Then it shows all of them improving at once, in a season that took less money.
The last Thursday in March, the trading review at Ashcombe in Trowbridge. Ashcombe sells denim and the things people wear with it: 112 stores and a website, and a buying office of eleven. Its customer buys a pair of jeans and comes back eighteen months later for the same pair in a darker wash.
On the screen is the autumn denim scorecard, this year against last. Rosalind Trescott buys denim. Gareth Winshaw plans it. Lorna Faircloth, the trading director, set the department one target in February: an achieved margin of 60.0%, up from a poor 54.8%.
They hit it. They hit everything.
Intake margin up. Achieved margin up, and past the target. Markdown less than half what it was. Sell-through up. Full-price sell-through up by twenty points. Stockturn up by a third. GMROI — the margin you get back for every pound tied up in stock — up by four fifths.
The denim department kept GBP 150,880 less than it kept the year before, and its contribution — what is left after the costs that did not change — fell by 28.8%.
Nobody in the room is lying, nothing on the scorecard is wrong, and no single person made a bad decision. This course is the arithmetic of how that happens, and what to put on a scorecard so that it does not.
The basis, settled once
Two conventions, stated here and then never restated, because half the confusion in retail arithmetic is an unstated basis.
- Every selling price in this course is net of sales tax. Ashcombe's market taxes clothing. The tax is collected at the till and passed on, so it is never the retailer's money. Course 16.1 does that conversion in full. Here the tickets have already had it taken off. The tax is proportional, so a percentage off the ticket is the same percentage off the net price. The markdown ladder below reads the same either way.
- Every cost in this course is landed cost — the FOB price (what the goods cost at the port they ship from) converted at the season rate, plus freight, duty and clearance. Again, 16.1 builds one; here it arrives built.
Course 16.1 also establishes the difference between markup and margin, the three margins a buyer is judged on, and how a markdown and a piece of terminal stock are priced. This course assumes all of it. What it adds is the level above: not what one measure means, but what happens when you run a business on six of them at once.
The trading data underneath everything
Autumn is twenty-six weeks at Ashcombe. Six denim lines, the same six both years — denim is a repeat business, which is what makes the comparison worth making at all. The markdown calendar is fixed and published to the stores in advance: full price to week 17, twenty per cent off to week 21, forty per cent off to week 24, sixty per cent off for the last two weeks. Whatever is left on the last day goes to a clearance trader at GBP 4.00 a unit.
Here is last autumn, unit by unit. Everything else in this course is derived from this table and the one after it.
| Line | Received | Sold | At full price | At -20% | At -40% | At -60% | Left | Net sales | Cost of goods | Gross margin |
|---|---|---|---|---|---|---|---|---|---|---|
| AS-2210 straight-leg jean | 16,000 | 15,950 | 8,500 | 2,600 | 2,550 | 2,300 | 50 | 586,350 | 233,600 | 352,950 |
| AS-2224 slim jean | 12,000 | 11,856 | 6,460 | 1,900 | 1,824 | 1,672 | 144 | 535,876 | 214,800 | 321,652 |
| AS-2236 high-rise skinny | 18,500 | 18,256 | 9,520 | 3,024 | 3,024 | 2,688 | 244 | 741,440 | 299,700 | 442,716 |
| AS-2248 wide-leg jean | 13,500 | 13,178 | 7,310 | 2,064 | 1,998 | 1,806 | 322 | 652,944 | 267,300 | 386,932 |
| AS-2260 trucker jacket | 11,500 | 7,104 | 4,080 | 1,104 | 1,008 | 912 | 4,396 | 415,296 | 281,750 | 151,130 |
| AS-2272 western shirt | 10,500 | 6,102 | 3,570 | 924 | 852 | 756 | 4,398 | 179,298 | 124,950 | 71,940 |
| Total | 82,000 | 72,446 | 39,440 | 11,616 | 11,256 | 10,134 | 9,554 | 3,111,204 | 1,422,100 | 1,727,320 |
The 9,554 units left over went to the clearance trader for GBP 38,216, which is inside the gross margin column. Total income for the season was therefore GBP 3,149,420: net sales of GBP 3,111,204 plus the clearance cheque.
And here is this autumn, the same six lines, after the department was asked for a better margin.
| Line | Received | Sold | At full price | At -20% | At -40% | At -60% | Left | Net sales | Cost of goods | Gross margin |
|---|---|---|---|---|---|---|---|---|---|---|
| AS-2210 straight-leg jean | 10,400 | 10,400 | 8,500 | 1,900 | 0 | 0 | 0 | 450,900 | 148,720 | 302,180 |
| AS-2224 slim jean | 7,800 | 7,800 | 6,460 | 1,340 | 0 | 0 | 0 | 414,260 | 137,280 | 276,980 |
| AS-2236 high-rise skinny | 12,000 | 12,000 | 9,520 | 2,480 | 0 | 0 | 0 | 575,200 | 190,800 | 384,400 |
| AS-2248 wide-leg jean | 8,800 | 8,800 | 7,310 | 1,490 | 0 | 0 | 0 | 510,120 | 170,720 | 339,400 |
| AS-2260 trucker jacket | 9,900 | 7,104 | 4,080 | 1,104 | 1,008 | 912 | 2,796 | 415,296 | 238,590 | 187,890 |
| AS-2272 western shirt | 9,000 | 6,102 | 3,570 | 924 | 852 | 756 | 2,898 | 179,298 | 105,300 | 85,590 |
| Total | 57,900 | 52,206 | 39,440 | 9,238 | 1,860 | 1,668 | 5,694 | 2,545,074 | 991,410 | 1,576,440 |
Clearance this year: 5,694 units for GBP 22,776. Total income GBP 2,567,850.
Two things to notice before any percentage is calculated, because they are the whole story and they are visible in the raw counts.
The full-price column is identical in both years — 39,440 units. The customer bought exactly as much at full price as she did last year, because the price ladder, the season and the product were the same. Nothing about demand changed.
Four lines have zeros in the discount columns. The four jeans did not sell fewer units at forty and sixty per cent off. They sold none, because by weeks 20 and 21 there were none left to sell. AS-2210, AS-2224 and AS-2248 ran out in week 20; AS-2236 in week 21. The department traded the last five or six weeks of a twenty-six-week season on a jacket and a shirt.
Seven measures, all derived from those two tables
Every figure below comes out of the two tables above and nothing else. Work them yourself; that is the point of the lesson.
Intake margin is the margin the goods came in at, at full price, before anything was sold: the full retail value of everything received, less what it cost. Last year Ashcombe received 82,000 units with a full retail value of GBP 4,287,500 against a cost of GBP 1,422,100, so intake margin was 66.8%. This year, 57,900 units worth GBP 3,033,000 at full price against GBP 991,410: 67.3%. Rosalind took between twenty and forty pence a unit off the programme prices. She did it with Beykara Denim, the Turkish mill behind the four jeans, and with the two suppliers behind the jacket and the shirt. It shows up here and nowhere else.
Achieved margin is gross margin over total income. Last year GBP 1,727,320 over GBP 3,149,420 is 54.8%. This year GBP 1,576,440 over GBP 2,567,850 is 61.4% — past Lorna's 60.0% target with room to spare.
Markdown percentage is the value given away on the units that sold, over what those units would have made at full price. Last year it was 17.8%; this year 7.0%. It more than halved.
Sell-through is units sold over units received. Last year 72,446 over 82,000 is 88.3%; this year 52,206 over 57,900 is 90.2%.
Full-price sell-through — the number a range's success actually turns on — is full-price units over units received. Last year 39,440 over 82,000 is 48.1%. This year the same 39,440 over 57,900 is 68.1%. Twenty points, on an unchanged numerator.
Stockturn is cost of goods sold over average stock held at cost. Ashcombe reads average stock off its own weekly file: the mean of the twenty-six weekly closing balances, valued at cost. Last year that averaged GBP 678,080; this year GBP 352,210. So stockturn went from 2.1 to 2.8.
GMROI is gross margin over the same average stock: last year GBP 1,727,320 over GBP 678,080, which is 2.5. This year GBP 1,576,440 over GBP 352,210, which is 4.5.
| Measure | Last autumn | This autumn | Direction |
|---|---|---|---|
| Intake margin | 66.8% | 67.3% | better |
| Achieved margin | 54.8% | 61.4% | better |
| Markdown | 17.8% | 7.0% | better |
| Sell-through | 88.3% | 90.2% | better |
| Full-price sell-through | 48.1% | 68.1% | better |
| Stockturn | 2.1 | 2.8 | better |
| GMROI | 2.5 | 4.5 | better |
GMROI, and what it is actually made of
GMROI stands for gross margin return on inventory investment. It answers the one question a margin percentage cannot: for every pound of the company's money this department held in stock, how many pounds of margin came back? It is the measure that settles an argument between a high-margin slow seller and a low-margin fast one. That is why it is the last line on most retail scorecards.
It also splits in two, and that split is where this lesson turns.
GMROI = gross margin / average stock at cost
      = (gross margin / income) x (income / average stock at cost)
      = achieved margin rate x sales-to-stock ratio
The two halves are two different jobs. The first is how good each sale is. The second is how hard the money worked. Ashcombe's two years:
| Achieved margin rate | Income divided by average stock | GMROI | |
|---|---|---|---|
| Last autumn | 54.8% | 4.64 | 2.5 |
| This autumn | 61.4% | 7.29 | 4.5 |
Both halves rose, which is why GMROI rose so far. The first rose because less was given away. The second rose because average stock fell by GBP 325,870 while income fell by GBP 581,570 — that is, the stock fell proportionally faster than the sales did, which is exactly what a ratio rewards.
Hold that sentence. It is the mechanism of the entire course.
Then somebody opened the till
| Last autumn | This autumn | Change | |
|---|---|---|---|
| Total income | 3,149,420 | 2,567,850 | down 18.5% |
| Gross margin | 1,727,320 | 1,576,440 | down 8.7% |
| Operating costs of the department | 1,204,000 | 1,204,000 | unchanged |
| Contribution | 523,320 | 372,440 | down 28.8% |
The department's operating costs — its share of store payroll and rent, its distribution, its marketing, its buying office — are GBP 1,204,000 and they are not a percentage of anything. A shop costs what it costs whether it sells 82,000 pairs of jeans or 57,900. So a gross margin that fell by GBP 150,880 took 28.8% of the department's contribution with it, because every pound of it came off the end.
And the sales line was never even challenged, because it was on plan. Gareth's February plan for autumn was net sales of GBP 2,540,000; the season delivered GBP 2,567,850, which is 101.1% of plan. Sales to plan is green too. A plan is a comparator you set yourself, and this one had been set to match the buy.
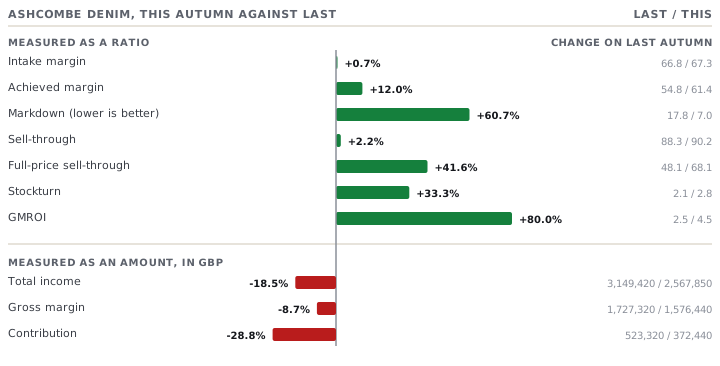
Every one of those measures is a ratio, and five of them share a denominator
Here is the property that makes a KPI system fail as a system while every part of it works.
Six of the seven measures on the scorecard are ratios. A ratio improves if the top number rises or if the bottom number falls, and the arithmetic cannot tell you which happened. So the question to ask of any measure is not "did it improve" but "which of its two halves moved, and did I want that half to move?"
| Measure | Denominator | How to improve it by trading less |
|---|---|---|
| Intake margin | Full retail value of the intake | Buy only the lines with the best cost-to-price ratio |
| Achieved margin | Total income | Refuse to sell anything at a discount |
| Markdown | Full-price value of the units that sold | Own too few units to have to discount any |
| Sell-through | Units received | Receive fewer units |
| Full-price sell-through | Units received | Receive fewer units |
| Stockturn | Average stock at cost | Hold less stock |
| GMROI | Average stock at cost | Hold less stock |
Read the "how to improve it by trading less" column downwards. It is one instruction written seven ways: own less. Every measure on the scorecard can be improved, honestly and with no manipulation at all, by an action that shrinks the business. Nobody at Ashcombe gamed anything. They were simply asked to improve a set of measures, and the shortest route to improving all seven at once happened to be the route that made the department smaller.
The one line on the whole review with no denominator was gross margin in cash. It is the only line that fell.
Check yourselfA department's sell-through improves from 84% to 92% and its buyer says the range was better. What is the first thing you ask for?Show the answer
The units received. Sell-through is units sold divided by units received. So a buy that is eight per cent smaller lifts sell-through by roughly eight per cent on its own, with an unchanged customer and an unchanged product. Ask for the top and bottom numbers separately. If the units SOLD also rose, the range really was better. If the units sold fell and only the bottom number moved, you have measured the buy, not the range. The same question answers itself for stockturn, GMROI and markdown percentage, and it is the single most useful habit in this course.
Check yourselfAshcombe's achieved margin rose 6.6 percentage points and its gross margin fell GBP 150,880. Can both be true?Show the answer
Yes, and they usually are when a rate improves because of what was not traded. Achieved margin is gross margin divided by income. This year both halves fell: income by 18.5%, gross margin by only 8.7%. A fraction whose bottom falls faster than its top gets bigger. That is all a rate improvement is here. It is what the arithmetic does when you drop the least profitable trade, which was still profitable. The rate has no opinion about size, and size is what pays the rent.
Prompt · Take my scorecard apart
When a review is entirely green and the business does not feel bigger.
Here is a departmental scorecard for two comparable periods, with the underlying trading data beneath it: units received, units sold at each price step, units left at the end, net sales, cost of goods and average stock at cost.

[PASTE THE SCORECARD AND THE TRADING DATA]

Do four things, in this order, and show every calculation.

1. For each measure on the scorecard, write down its top number and its bottom number, and say which of the two moved between the periods and by how much. Do not summarise a measure as up or down without saying which half moved.
2. Work out every measure again from the trading data rather than trusting the scorecard, and flag any that do not agree.
3. Add the lines with no bottom number: gross margin in cash, and gross margin less any cost that did not change between the periods. Show them as an amount and as a percentage change.
4. List which measures could have been improved by owning fewer units, and say for each whether that is what actually happened here.

Do not tell me whether the period was good or bad. Give me the top and bottom number for each measure and let me decide.
AI can make mistakes — check anything you act on.
Where this goes next
You now have a whole KPI set derived from one season's trading file, and one uncomfortable observation: the set moved as one, and it moved because the department owned less, not because it traded better.
That still leaves the question the review never asked. Ashcombe cut its buy by 24,100 units. Some of that cut was right — 9,554 units went to a clearance trader last year at GBP 4.00 each, and nobody should defend those. Lesson 2 takes the GBP 150,880 apart into the three decisions that produced it, and finds that the argument everybody had in the room was about the smaller half.