Lessons · Lesson 1 of 3
The floor you actually have
Measure a shop before you redraw it: the selling area, the frontage you can hang goods on, the gates a shopper walks past, and the route they really take.
Lesson 1 of 3 · 35 min
A plan is a drawing of a building that already exists
A shop is not one space. Part of it sells. Part of it holds goods no customer will ever see. Part of it is corridor, counter and staff room. The lease gives you one figure that adds all three together. The figure is true, and it will mislead anybody who plans a floor with it. This lesson is the survey you do before you draw a plan.
Coldstrand runs fifteen menswear shops. Sallowgate is the second largest. On the day this course starts it is also the one nobody is happy with. Sales have been flat for two years and the stockroom is full. And one category — accessories — is the thing the buying team believes is the best in the business, and almost nobody in the shop can find it.
Ruth Alsager runs space planning for the chain. She has been asked to redraw Sallowgate. Before she draws anything she spends three weeks measuring, and this lesson is those three weeks. A layout argument that starts with an opinion about where suits ought to sit is an argument nobody can win or lose.
Four things get measured, in this order: the box, the frontage, the traffic, and the route. Every number in lessons 2 and 3 comes out of one of them.
The box: three different areas, and only one of them sells
The lease says 520 square metres. That figure is correct and useless.
| What | Square metres | Sells? |
|---|---|---|
| Gross internal area | 520 | — |
| Stockroom, goods-in, staff room, plant | 96 | No |
| Fitting rooms (six cubicles and the lobby) | 24 | No, and it earns anyway |
| Till and wrap counter | 16 | No |
| Net selling area | 384 | Yes |
Take the shop's sales for the last 52 weeks: GBP 1,249,000, excluding VAT (value added tax, the sales tax charged in the United Kingdom). Divide that by 384 and you get GBP 3,252.60 a square metre a year. That is the number Coldstrand's board looks at, and it is a good number for comparing Sallowgate against the other fourteen shops.
It cannot help Ruth at all. It is one number for a floor with a front, a middle and a back. Those three parts behave nothing like each other, and averaging them is exactly the operation that hides the problem.
The frontage: what the shopper can actually be shown
Square metres are how the landlord charges you. Linear metres of merchandisable frontage are what you actually allocate. Merchandisable frontage is the running length of fixture you can hang or fold goods on: a wall bay hangs a metre and a quarter of garments whether the aisle in front of it is generous or mean.
Ruth counts the fixtures in the shop and converts them at Coldstrand's standard rates.
| Fixture | Count | Frontage each | Frontage |
|---|---|---|---|
| Wall bay | 48 | 1.25 m | 60.0 m |
| Midfloor four-way | 18 | 2.40 m | 43.2 m |
| Nesting table | 14 | 1.80 m | 25.2 m |
| Gondola end | 7 | 2.80 m | 19.6 m |
| Total merchandisable frontage | 148.0 m |
Two things follow from that total, and both of them shape everything after it.
The first: 148 metres is fixed until somebody spends money. It is not a target, a plan or an aspiration. It is the number of metres the shop has. There are only three ways to change it: buy fixtures, narrow the aisles, or take space back from something that is not selling. All three cost money, and two of them run into the law. That is lesson 3.
The second: a reallocation is a swap. Every metre given to one category is taken from another. Nobody in a range meeting ever says "and to pay for that, tailoring loses four metres". That is why range meetings produce plans that do not fit in the shop.
The traffic: four zones and three gates
Coldstrand's door counter has been running for years and counts one thing: entries. 208,000 a year, 4,000 a week. Against 41,600 transactions that is a conversion rate of 20.0% — one shopper in five buys something — and an average basket of GBP 30.02 excluding VAT.
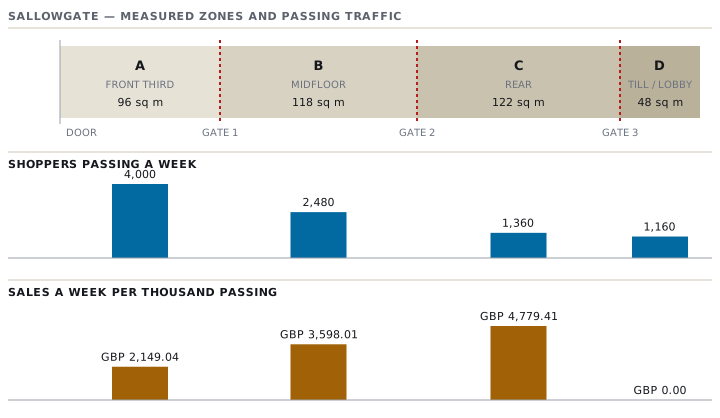
For three weeks Ruth adds three counting beams inside the shop, on the lines where the floor naturally divides, and calls each of them a gate. The zones between them are the shop's real geography.
| Zone | Where | Square metres | Passing a week | Penetration |
|---|---|---|---|---|
| A | Front third, from the door to gate 1 | 96 | 4,000 | 100% |
| B | Midfloor, gate 1 to gate 2 | 118 | 2,480 | 62% |
| C | Rear, beyond gate 2 | 122 | 1,360 | 34% |
| D | Fitting-room lobby and till run, beyond gate 3 | 48 | 1,160 | 29% |
Penetration is the share of everyone who walks in that reaches a zone. Read that column slowly. Thirty-eight out of every hundred people who walk into Sallowgate never reach the middle of the shop, and sixty-six never reach the back. Nobody had ever counted it. Everyone in the business, asked to guess, said "most people go round the whole shop".
Now put the sales against the zones.
| Zone | Categories standing there | Sales GBP | Sales a square metre GBP | Sales a week per thousand passing GBP |
|---|---|---|---|---|
| A | Casual tops, denim, outerwear | 447,000 | 4,656.25 | 2,149.04 |
| B | Shirts, knitwear | 464,000 | 3,932.20 | 3,598.01 |
| C | Tailoring, accessories | 338,000 | 2,770.49 | 4,779.41 |
| D | Nothing — fitting rooms, till, a promotional graphic | 0 | 0.00 | 0.00 |
The last two columns — sales a square metre, and sales a week per thousand passing — rank the shop in opposite orders, and that single fact is the reason this course exists.
By the square metre, the front is the best part of the shop and the back is the worst, by a factor of 1.68. By the shopper who actually walks past, the back is the best part of the shop and the front is the worst, by a factor of 2.22. Both are arithmetically correct. They are answers to different questions.
The route: eight walks and four hundred and eighty shoppers
Counts tell you how many. They do not tell you why, and a plan drawn from counts alone moves the right category to the wrong place.
So Ruth walks the shop eight times at different hours with a stopwatch and a floor plan, and the Sallowgate team observes and tallies 480 entrants over nine days. Four findings. All of them are Coldstrand's own measurement in its own shop. None of them is a general law about shoppers.
- Of 480 observed entrants, 341 turned right within three paces — a little over seven in ten. The right-hand wall from the door is casual tops. Nobody chose that; it is where casual tops has been since 2019.
- The first 4.5 metres inside the door are dead. Two nesting tables stand there. Twenty-two of the 480 stopped at them. Shoppers walk through that band at close to their pavement pace and register almost nothing in it.
- From gate 1 you cannot see the tailoring. Three accessory gondolas, 2.80 metres each, stand across the sightline between the middle of the shop and the suit wall at the back. Ruth's eight walks all confirm it: a shopper standing at gate 1 sees a wall of ties and belts and, behind it, nothing they can identify.
- The till queue is a stationary audience with nothing to look at. Four hundred and eighty transactions were timed at the counter over two weeks. The median wait before service was 74 seconds, and the wall those shoppers face carries a seasonal graphic.
Findings 3 and 4 hold the whole of lesson 2. The best-converting category in the shop stands in front of the highest-value category in the shop, hiding it. And about a thousand shoppers a week stand still for over a minute in a zone that has no merchandise in it at all.
What has been established, before any opinion is offered
- The shop has 384 square metres of selling floor and 148.0 metres of frontage, and neither grows without capital.
- Sixty-six per cent of entrants never reach the back third.
- The rear zone converts its traffic more than twice as hard as the front zone, and looks like the worst part of the shop when you measure it by the floor.
- Roughly 1,160 shoppers a week stand in a zone containing no merchandise.
- The sightline from the middle of the shop to the highest-value category is blocked by a fixture.
Not one of those is a proposal. That is deliberate. Lesson 2 turns them into a frontage allocation and tests two adjacencies against basket data — one of which survives and one of which does not.
Check yourselfSallowgate's front zone returns GBP 4,656 a square metre and the rear returns GBP 2,770. A regional manager concludes the rear is underperforming and should be given to the categories at the front. What is wrong with the inference?Show the answer
It compares the two zones on a denominator that neither zone controls. Every entrant walks through the front zone; a third of them reach the rear. So the front should out-sell the rear per square metre even if the merchandise in it were doing a much worse job. That is what the other column shows: per thousand shoppers who actually pass, the rear returns GBP 4,779.41 a week and the front GBP 2,149.04. The rear is not underperforming; it is under-visited. Those two diagnoses have opposite remedies. If the rear were underperforming you would change the merchandise. Because it is under-visited, you change the route to it — which is a fixture decision, not a buying decision, and it is the one Coldstrand takes in lesson 3.
Prompt · Turn my shop into zones and gates
Before you redraw anything: you have a floor plan and some counts, and you need them in a shape a layout argument can be made from.
I am space planning one retail store and I need to measure it before I redraw it. Here is what I have: [paste the floor plan description, the areas in square metres, the fixture list, the door count and any internal counts you have].

Help me build a zone-and-gate measurement sheet:
1. Separate gross internal area, non-selling area (stockroom, staff, plant), fitting rooms, till and wrap, and net selling area. Tell me which of my figures are missing and what I would have to measure to get them.
2. Convert my fixture list into linear metres of merchandisable frontage, using the frontage-per-fixture rates I give you, and total it.
3. Propose where the internal counting lines (the gates) should sit, so the zones between them are commercially meaningful. For each one, tell me what could contaminate the count: a queue tail, a stair, a lift lobby.
4. For each zone give me: square metres, shoppers passing a week, penetration as a percentage of entries, sales, sales per square metre, and sales a week per thousand passing.
5. Point out where sales per square metre and sales a week per thousand passing rank the zones in different orders, and say in one sentence what each order means.

Do not recommend any change to the layout. Ask me for anything you need instead of assuming it, and mark any figure you have worked out yourself rather than been given.
AI can make mistakes — check anything you act on.