Lessons · Lesson 1 of 3
A customer file is a distribution
Read a two-year customer file as counts rather than averages: how many bought once and never came back, what the top tenth really carries, why an average order value can rise while every part of the file falls, and how far a value estimate can honestly be pushed.
Lesson 1 of 3 · 38 min
The brand, the file, the basis
Every business that sells to named people ends up with a list of them. The reflex is to sum that list up with an average. An average spend, an average order, an average customer. But the people on the list are nothing like one another. The average describes almost none of them. So this lesson counts the file instead.
Quillingford sells knitwear and accessories online. No shops, no wholesale. One website, one email list. This course uses one thing: its customer file for the twenty-four months from 1 January 2026 to 31 December 2027.
Four people appear, and none of them is careless.
- Roshan Velayudhan owns the customer data. He can produce any count anybody asks for.
- Bettina Kerslake is the merchandiser. She owns the quantity and the money.
- Greta Stallybrass runs brand and marketing. She wants a loyalty scheme, and her reasons are good ones.
- Emlyn Wragge is the finance director. He signs the scheme off, or he does not.
Say the basis once, because every figure in three lessons rests on it. Revenue is net of returns and excludes VAT (value added tax). An order means a despatched order, net of cancellations. A customer means one identified buyer, matched on email address. Quillingford's measured gross margin rate on revenue is 58.0% — the share of revenue left after the cost of the goods. Its measured variable cost per order is GBP 7.40: picking, packing, carriage and payment fees. Those two numbers turn revenue into money the business keeps, and every calculation from here on uses them.
The file, as counts
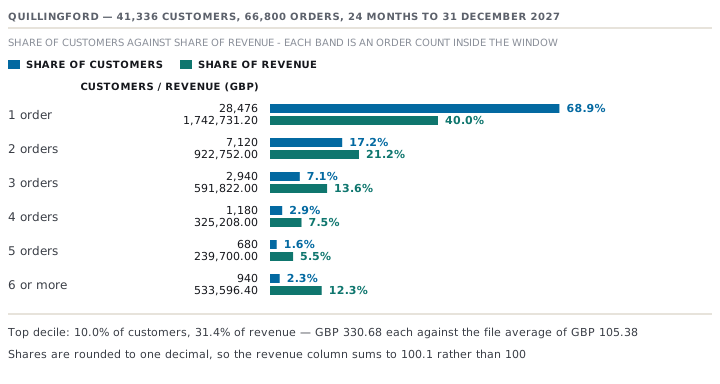
Here is the whole file in one table: how many times each customer ordered inside the window, how many customers did that, and what they spent.
| Orders in the window | Customers | Orders | Revenue, GBP | Average order value, GBP |
|---|---|---|---|---|
| 1 | 28,476 | 28,476 | 1,742,731.20 | 61.20 |
| 2 | 7,120 | 14,240 | 922,752.00 | 64.80 |
| 3 | 2,940 | 8,820 | 591,822.00 | 67.10 |
| 4 | 1,180 | 4,720 | 325,208.00 | 68.90 |
| 5 | 680 | 3,400 | 239,700.00 | 70.50 |
| 6 or more | 940 | 7,144 | 533,596.40 | 74.69 |
| Whole file | 41,336 | 66,800 | 4,355,809.60 | 65.21 |
Average order value, or AOV, is simply revenue divided by orders. The 940 customers in the last band placed an average of 7.6 orders each, which is where 7,144 comes from.
Three numbers fall straight out of that table. Only one of them ever reaches a board report.
- Orders per customer: 1.62. 66,800 divided by 41,336.
- Revenue per customer: GBP 105.38. 4,355,809.60 divided by 41,336.
- Share who bought once and never came back: 68.9%. 28,476 divided by 41,336.
The third one matters most, and an average hides it completely. The typical Quillingford customer is not somebody who spends GBP 105.38. There is no such person. The typical customer bought once, spent about GBP 61, and has not been seen since. An average sums up a distribution. When the distribution leans this hard to one side, the summary describes nobody in it.
Where the money actually is
Rank every customer by what they spent in the window and take the top tenth. That top tenth is called the decile: 4,134 customers, or 10.0% of the file. From the table, it is everyone with four or more orders (940 plus 680 plus 1,180 = 2,800), plus the 1,334 highest-spending of the 2,940 three-order customers.
Their revenue: GBP 533,596.40 plus GBP 239,700.00 plus GBP 325,208.00. Then 1,334 three-order customers at the band's GBP 201.30 each, which is GBP 268,534.20. Total GBP 1,367,038.60.
- The top decile is 31.4% of the revenue.
- Each of them is worth GBP 330.68 over the window. The file average is GBP 105.38, so that is 3.14 times the average customer.
Building the decile out of the bands, rather than out of a strict ranking, is a small approximation. It treats every three-order customer as spending the band average. In reality a few two-order customers outspend a few three-order ones, and the boundary moves slightly. It does not move the conclusion, and saying so costs nothing.
The average that rose while both halves fell
Roshan was asked a simple question in January 2028: did the average order value go up or down last year? Here is the answer, split by whether the order was a customer's first or a repeat.
| Year | First orders | AOV, GBP | Repeat orders | AOV, GBP | All orders | Revenue, GBP | AOV, GBP |
|---|---|---|---|---|---|---|---|
| 2026 | 19,400 | 61.50 | 8,600 | 72.90 | 28,000 | 1,820,040.00 | 65.00 |
| 2027 | 21,936 | 60.40 | 16,864 | 71.80 | 38,800 | 2,535,769.60 | 65.35 |
The headline is up 0.5%, from GBP 65.00 to GBP 65.35. Every part of the file went the other way.
- First orders fell from GBP 61.50 to GBP 60.40, down 1.8%.
- Repeat orders fell from GBP 72.90 to GBP 71.80, down 1.5%.
Both halves fell and the whole rose, because the weights moved. Repeat orders are the more valuable kind, and they went from 8,600 of 28,000 orders (30.7%) to 16,864 of 38,800 (43.5%). The mix moved almost thirteen points towards the higher-value group, and that shift is bigger than the decline inside either group.
Course 19.4 measures the same trap on device mix, and the arithmetic is identical. What is different here, and worth saying out loud, is whose fault the weight is. A device mix moves because the world changes. A first-versus-repeat mix moves because you decided how much to spend acquiring people, and how hard to work the file you already had. Quillingford's mix shifted because acquisition grew slower than the base of existing customers. The number behind the flattering headline is a number the business controls, and that makes reporting the headline without the split worse than useless.
The honest way to answer is to hold the mix still and ask what the rates did. Two ways round, both reported.
- 2027's rates at 2026's mix: 0.692857 times GBP 60.40 plus 0.307143 times GBP 71.80 = GBP 63.90, against 2026's actual GBP 65.00. Down 1.7%.
- 2026's rates at 2027's mix: 0.565361 times GBP 61.50 plus 0.434639 times GBP 72.90 = GBP 66.45, against 2027's actual GBP 65.35. Down 1.7%.
Both directions say the same thing to one decimal place, which is the reassurance you want before quoting either. The true movement in what a Quillingford order is worth is minus 1.7%, not plus 0.5%.
What a customer is worth, and what that number cannot know
Now the number everyone wants: what is a customer worth?
Contribution is what a sale leaves behind after the cost of the goods and the direct costs of the order. It is revenue times the gross margin rate, less the variable cost of the orders:
contribution = revenue times 0.58, less GBP 7.40 per order
For the whole file: GBP 4,355,809.60 times 0.58 is GBP 2,526,369.57. Less 66,800 orders at GBP 7.40, which is GBP 494,320.00. Contribution GBP 2,032,049.57. That is GBP 49.16 per customer acquired, or GBP 30.42 per order.
Now split it by acquisition cohort — the group of customers who placed their first order in the same year. It looks very different.
| Cohort | Customers | Orders to 31 Dec 2027 | Revenue, GBP | Contribution, GBP | Per customer, GBP |
|---|---|---|---|---|---|
| Acquired 2026 | 19,400 | 39,290 | 2,639,694.00 | 1,240,276.52 | 63.93 |
| Acquired 2027 | 21,936 | 27,510 | 1,716,115.60 | 791,773.05 | 36.09 |
| Both | 41,336 | 66,800 | 4,355,809.60 | 2,032,049.57 | 49.16 |
Do not read that table as saying the 2027 intake is worse. It says the 2027 intake is younger. A customer acquired in February 2026 has had twenty-three months to place a second order. One acquired in November 2027 has had six weeks. The gap between GBP 63.93 and GBP 36.09 is mostly the gap between twenty-three months of trading and six weeks of it, and none of it can be separated out by staring harder at the two totals.
This is the commonest mistake made with a customer file, and it is made in both directions. Read one way it condemns the newest intake. Read the other way it says the business is getting worse at acquiring, and that is the version that reaches a board paper.
The fix is to compare a window every cohort has completed. Every customer in both cohorts who bought on or before 30 September 2027 has had at least ninety days on file. So ninety days from each customer's own first order is a window both cohorts have finished.
| Cohort | Customers with a complete 90 days | Orders in those 90 days | Revenue, GBP | Contribution, GBP | Per customer, GBP |
|---|---|---|---|---|---|
| Acquired 2026 | 19,400 | 23,860 | 1,510,300.00 | 699,410.00 | 36.05 |
| Acquired 2027, on or before 30 Sep | 16,704 | 20,290 | 1,268,300.00 | 585,468.00 | 35.05 |
Like for like, the 2027 intake is worth GBP 35.05 against the 2026 intake's GBP 36.05. That is a fall of 2.8%, not the collapse from GBP 63.93 to GBP 36.09 that the raw table appears to show. The second-order rate says the same thing: 22.0% of the 2026 cohort placed a second order within ninety days (4,268 of 19,400), against 20.7% of the comparable 2027 cohort (3,459 of 16,704).
A small deterioration, honestly measured, is worth more than a large one measured wrongly. It is also something you can act on, which the wrong number is not.
What this estimate is, and what it is not
GBP 36.05 is contribution actually earned in the first ninety days. It is not a lifetime value, and the difference is worth being pedantic about, because the phrase "lifetime value" invites three assumptions the file cannot support.
- It assumes a lifetime. Nobody at Quillingford knows how long a customer relationship lasts, because the business is two years old and the file has no end. Any projection past the observation window is a model, and a model needs its assumptions written next to its output.
- It assumes the margin rate holds. The 58.0% is the measured blended rate over twenty-four months. If the mix moves towards accessories, or towards discount, it moves.
- It assumes the future looks like the past. Two cohorts, one of them barely observed, is a thin basis for that.
What the number is good for is a floor and a comparison. GBP 36.05 is a floor for the 2026 cohort: they earned at least that, and the figure can only rise as they keep buying. And because both cohorts are measured over the same window, the comparison between them is sound, even though neither is a lifetime.
That is enough to decide most things. It is not enough to say "we can afford to pay GBP 40 to acquire a customer" without also saying how long you are prepared to wait to get it back.
Check yourselfQuillingford's blended AOV in 2027 was GBP 65.35, up 0.5% on 2026. Bettina says the range is trading up. What do you tell her, and what would you check before agreeing?Show the answer
That the blended figure rose because the order mix moved towards repeat orders, from 30.7% to 43.5% of all orders, and repeat orders carry a higher AOV than first orders. Both underlying rates fell — first orders 1.8%, repeat orders 1.5% — and holding the mix still either way round gives a fall of 1.7%. So the range is not trading up; the file is simply older. To check whether the range really is trading up, you would want AOV by category and by cohort age, not by calendar year, because calendar year mixes the range up with the order mix.
Check yourselfSomeone proposes an acquisition budget of GBP 45 a customer, on the grounds that a customer is worth GBP 49.16. What is wrong with the reasoning?Show the answer
GBP 49.16 is contribution earned across a file whose 2026 cohort has had up to twenty-four months and whose 2027 cohort has had as little as six weeks. So it is neither a lifetime figure nor a figure any single cohort has actually reached. The comparable, completed measurement is GBP 36.05 in the first ninety days, which is below GBP 45. Paying GBP 45 may still be right, but only if the business can say how many months it is prepared to wait for the balance, and can show a cohort that has actually got there. Nothing in a two-year file shows that yet, so the honest answer is that the payback period is unknown.
Prompt · Read my customer file as a distribution
When you have a customer export and a revenue total, and everything anybody quotes about it is an average.
I have one customer file and I want it read as a distribution rather than as an average. I will give you, for a stated window with its start and end dates, a table of order-count bands: how many customers placed exactly one order, exactly two, and so on, with the orders and the revenue in each band. I will also give you my measured gross margin rate on revenue, and my measured variable cost per order.

Work out and show: orders per customer, revenue per customer, and the share of customers who bought once and never came back. Then rank the file and give me the top tenth's share of revenue, and its revenue per head against the file average. Say plainly if you had to approximate that boundary from the bands rather than from a full ranking. Then contribution: revenue times my margin rate, less my variable cost times the orders, for the whole file and per customer acquired.

Then the intake question, which is where I expect to be wrong. Split by the period in which each customer placed their FIRST order. Do not compare intakes over the whole window. Instead pick a fixed number of days from each customer's own first order that EVERY intake has completed, tell me which customers that leaves out, and compare the intakes only over that window. Give me the second-order rate inside it as well.

Four rules. Do not quote me any benchmark for repeat rate, retention or loyalty uplift from anywhere; every number must come from my file. Customers who have not completed the comparison window are UNKNOWN, not zero and not the intake average, and you should say so and name the date the cell can be filled in. Do not call the result a lifetime value, because I have not observed a lifetime. And if my blended average order value moved, split it into first and repeat orders and hold the mix still both ways round before telling me what the rates did.
AI can make mistakes — check anything you act on.