Lessons · Lesson 2 of 3
The segment that changes a decision
Band the same file by recency, frequency and value, test each banding against a real decision on a quarter it could not see, and take apart a VIP tier that turns out to be measuring how long somebody has been on the list.
Lesson 2 of 3 · 36 min
A segment is a group you would treat differently
There is a way to find out whether your way of dividing up customers is any good. It is not to admire the table. You fix the groups on a chosen day, and then look away. Months later you count what each group actually went on to do. Those are months the grouping could not possibly have known about.
Everybody who has ever exported a customer list has made a segment. Most of them are columns.
The test is not whether the groups differ. Any two groups differ on something if you look at enough columns. The test is whether you would do something different to them. If the email, the offer, the mailing and the budget would be identical for both groups, you have not segmented the file. You have sorted it.
So this lesson does the banding, and then puts a real decision behind it.
The decision. Greta wants to post a printed catalogue to lapsed customers in January 2028. The all-in cost is GBP 4.00 a customer: print, postage, data preparation and returned mail. From lesson 1, Quillingford's contribution per order is GBP 30.42. So the mailing pays for itself only if it causes an extra order in more than
GBP 4.00 divided by GBP 30.42 = 13.1% of the people who receive it
That single number turns the banding below from a report into a decision. Any band the mailing cannot plausibly move by thirteen points is a band you do not mail.
Recency, banded and then tested
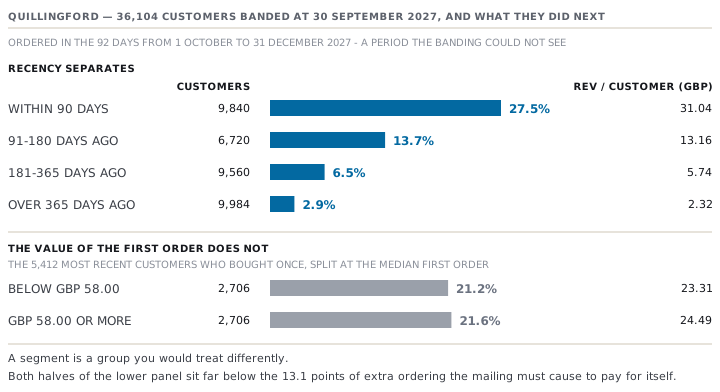
Recency means how long ago somebody last bought. Roshan banded the file as it stood on 30 September 2027 — 36,104 customers, being everyone who had bought at least once by that date — by how long ago their last order was. Then he left the bands alone and counted what each one did in the 92 days from 1 October to 31 December 2027, which none of the banding could see.
| Last order, at 30 September 2027 | Customers | Ordered in the quarter | Rate | Orders | Revenue, GBP | Revenue per customer, GBP |
|---|---|---|---|---|---|---|
| Within 90 days | 9,840 | 2,706 | 27.5% | 4,290 | 305,448.00 | 31.04 |
| 91 to 180 days ago | 6,720 | 921 | 13.7% | 1,271 | 88,462.00 | 13.16 |
| 181 to 365 days ago | 9,560 | 622 | 6.5% | 794 | 54,872.00 | 5.74 |
| More than 365 days ago | 9,984 | 289 | 2.9% | 341 | 23,180.00 | 2.32 |
| All | 36,104 | 4,538 | 12.6% | 6,696 | 471,962.00 | 13.07 |
Recency separates hard. The most recent band orders at 9.5 times the rate of the most lapsed one, and is worth 13.4 times as much per head over the quarter. That is a segment by any test. You would not spend the same money on those two groups, and you would not send them the same thing.
Now put the mailing decision against it. Break-even is 13.1 percentage points of extra ordering.
- More than 365 days ago. Baseline 2.9%. To pay for itself the catalogue must take those customers to 16.0%, which is 5.5 times what they do on their own. Nothing in this file suggests a catalogue does that.
- 181 to 365 days ago. Baseline 6.5%. It must reach 19.6%, three times the baseline.
- 91 to 180 days ago. Baseline 13.7%. It must reach 26.8%, which is a doubling. That is hard, but it is the same size as things that have worked elsewhere in the business. This is the band worth testing.
- Within 90 days. Baseline 27.5%. Most of these people are coming back anyway, and mailing all 9,840 of them costs GBP 39,360.00 to reach 2,706 who were going to order regardless.
Frequency inside recency: still a segment
Recency is not the only thing in the file. Take the 9,840 most recent customers and split them by how many orders they had placed by 30 September 2027.
| Orders by 30 September 2027 | Customers | Ordered in the quarter | Rate | Revenue, GBP | Revenue per customer, GBP |
|---|---|---|---|---|---|
| 1 | 5,412 | 1,158 | 21.4% | 129,350.00 | 23.90 |
| 2 | 2,214 | 664 | 30.0% | 74,970.00 | 33.86 |
| 3 or more | 2,214 | 884 | 39.9% | 101,128.00 | 45.68 |
| All recent | 9,840 | 2,706 | 27.5% | 305,448.00 | 31.04 |
That is a real second dimension. Inside a single recency band the ordering rate runs from 21.4% to 39.9%, and revenue per head from GBP 23.90 to GBP 45.68, a spread of 1.9 times. A customer who has bought three times and bought recently is a different proposition from one who bought once and bought recently, and you would treat them differently. The first is worth a new-season preview. The second is worth whatever it takes to get a second order.
Value inside frequency: a column, not a segment
Now the split that fails the test. Take the 5,412 recent customers who have bought exactly once, and split them at the middle value of that single order, GBP 58.00.
| Value of the one order | Customers | Ordered in the quarter | Rate | Revenue, GBP | Revenue per customer, GBP |
|---|---|---|---|---|---|
| Below GBP 58.00 | 2,706 | 574 | 21.2% | 63,080.00 | 23.31 |
| GBP 58.00 or more | 2,706 | 584 | 21.6% | 66,270.00 | 24.49 |
The two halves differ by 0.4 percentage points on rate, and by GBP 1.18 a head over the quarter, which is 5.1%. Whether that difference is real at all is course 19.4's question, not this one. The merchandising point stands either way: the mailing decision is identical for both halves. Both sit far below the 13.1-point break-even. Both would get the same email, the same offer and the same budget. Nothing you would do changes when you learn which half a customer is in.
So it is a column. Keep it in the export if you like. Do not put it in the segmentation, and do not build a campaign on it. Above all, do not let it be the reason the segmentation has eleven cells nobody can act on.
The VIP tier that was measuring tenure
Quillingford's email platform has a tier called VIP (very important person), defined as a customer whose total spend has reached GBP 300. At 30 September 2027 it held 3,148 customers, and it got the early access, the free returns and the birthday voucher.
Roshan looked at where they came from.
- 2,330 of the 3,148, which is 74.0%, were acquired in 2026.
- Only 818, or 26.0%, were acquired in 2027.
The file itself is nothing like that split. Of the 36,104 customers banded on 30 September 2027, 19,400 were acquired in 2026: 53.7%. If reaching GBP 300 had nothing to do with how long you had been on the list, you would expect about 1,692 of the tier to be 2026 customers. There are 2,330, which is 38% more than length of time on the list alone would predict.
The reason is not subtle once it is stated. A cumulative threshold is a race, and the 2026 cohort had a year's head start. A tier defined by total spend is partly a tier of people who have been here longer, so the loyalty budget flows towards age rather than towards behaviour.
The correction is to measure per unit of exposure: spend per month on file.
| VIP members | Count | Average months on file | Average spend, GBP | Spend per month on file, GBP |
|---|---|---|---|---|
| Acquired 2026 | 2,330 | 16.2 | 412.60 | 25.47 |
| Acquired 2027 | 818 | 6.8 | 388.40 | 57.12 |
The 2027 members reached almost the same total in less than half the time: GBP 57.12 a month against GBP 25.47, a rate 2.2 times higher. The tier ranks them together and treats them identically. So the fastest-spending customers in the business get exactly the same recognition as customers who reached the threshold by simply not going away.
Rebuild the tier on spend per month on file, keep it the same size at 3,148, and the make-up inverts: 1,486 from the 2026 cohort (47.2%) and 1,662 from 2027 (52.8%). Only 1,904 customers, or 60.5%, are in both versions. The other 1,244 are the whole argument. They are the people whose treatment changes depending on which definition wins. Until somebody looks at that number, the choice of definition feels like a naming decision rather than a budget decision.
Personal data, briefly and honestly
Everything in this lesson is personal data about identifiable people, and it is regulated. This is a merchandising course and not a legal one, so it will say only what is true everywhere and then stop.
Customer data is held on some legal basis, and that basis limits what you may do with it. People generally have a right to know what you hold about them and to ask you to delete it. Data collected for one stated purpose is not automatically available for another. Consent to receive marketing is not consent to everything, and a segment built for one campaign does not carry its permissions to the next one. Holding more than you need is a cost and a liability rather than an asset.
The rules differ by country, they change, and this course names no statute, article or fine. Find out which regime applies to your customers, read it or have somebody read it for you, and design the segmentation to fit it rather than asking forgiveness afterwards. The practical merchandising consequence is small and worth saying. A segmentation you cannot lawfully act on is not a segmentation. So the permissions belong in the same table as the counts, and a band whose members have not agreed to be mailed should show a mailable count next to its total. Otherwise the plan is built on a population that does not exist.
Check yourselfA colleague proposes mailing all 9,984 customers whose last order was more than a year ago, on the grounds that reactivating a lapsed customer is cheaper than acquiring a new one. Price the proposal.Show the answer
Mailing 9,984 customers at GBP 4.00 costs GBP 39,936.00. At GBP 30.42 of contribution an order, the mailing needs an extra order from 13.1% of them to break even, on a band whose baseline ordering rate for the quarter was 2.9%. The catalogue would have to take them to 16.0%, which is 5.5 times what they do unprompted. The 91-to-180-day band is the one worth testing: its baseline is 13.7%, and break-even asks for a doubling rather than a multiple. And whichever band is chosen, the test needs a randomly withheld group, because the response rate of a mailed list is not the effect of mailing it.
Check yourselfWhy does splitting the once-only recent customers at a GBP 58.00 first order fail as a segment, even if the difference between the halves is genuine?Show the answer
Because nothing you would do changes. The two halves ordered in the following quarter at 21.2% and 21.6%, and were worth GBP 23.31 and GBP 24.49 a head, a difference of 5.1%. Both sit far below the 13.1% response the mailing needs to pay for itself. The same offer, the same email and the same budget apply to both, so knowing which half a customer is in changes no decision. It is a column in an export. The frequency split inside the same recency band does pass the test, because 21.4% against 39.9% is a difference large enough that you would spend differently.
Prompt · Tell me whether my segment changes a decision
Before a proposed segmentation becomes a campaign plan, and before anybody builds eleven cells nobody can act on.
I want to test a proposed customer segmentation against a real decision, instead of admiring it in a spreadsheet.

First the decision. I will give you an action, its all-in cost per customer, and my contribution per order. Work out the break-even: the extra ordering rate, in percentage points, that the action must cause to pay for itself. Show that number before anything else, because it is what the rest is judged against.

Then the banding. I will give you the bands as they stood on a stated cut-off date, and separately what each band did in a following period that the banding could not see. Give me, band by band: customers, the number who ordered, the rate, revenue, and revenue per customer. Report the ratio between the strongest and the weakest band, on both rate and revenue per head.

Then judge each band against the break-even. For each one, state the baseline rate, the rate the action would have to reach, and that as a multiple of the baseline. Name the band worth testing, and say plainly which bands are not worth mailing at all.

Then do the same for a split I suspect is only a column. Two groups whose expected values differ by less than the break-even are a column, not a segment, and I want you to say so in those words.

Five rules. A baseline rate is not an effect: never report the response of a treated group as the effect of the treatment, and tell me the test needs a randomly withheld group. Do not import a benchmark response rate from anywhere. If a band is measured over a period some of its members had not completed, say the number is unknown. If any tier or threshold in my data is cumulative, check whether it is partly measuring how long somebody has been on the file, by comparing spend per month on file rather than total spend. And add a column for how many customers in each band I actually have permission to contact, because a band I cannot lawfully mail is not a plan.
AI can make mistakes — check anything you act on.