Lessons · Lesson 3 of 3
The finishing end is a queue
How to read a finishing hall as a set of station rates against one demand, why the station everybody blames is the one with the most spare capacity, and what a rework loop does to a bottleneck that looks like it has enough.
Lesson 3 of 3 · 38 min
819 shirts you cannot see
By the last stretch of a clothing factory, the shirts are finished. Nothing is being made any more. They are only tidied, checked, folded and boxed, and that work takes a few minutes each. Yet a shirt can spend most of a working day there, standing in a queue. This lesson finds the station that is really holding up the rest, and shows why counting shirts is not counting work.
Ihab Masri has said the same thing at every Monday meeting for a year: the needle detector is holding up the finishing hall. It stops. It beeps. Everything behind it waits while somebody works out why. He would like a second one.
Dalia Qutub tagged 40 shirts at the exit of the press cell and found them again at the carton. The average shirt took 3.9 hours to cross a hall that holds under seven minutes of actual work a shirt: 1.90 minutes of pressing and 4.94 minutes across the six stations below. At an arrival rate of 210 shirts an hour, 3.9 hours inside means the hall is holding
shirts in the hall = arrival rate x time inside
                   = 210 x 3.9
                   = 819 shirts
at any moment. The overhead rail through the hall holds 640. The other 179 are in trolleys, on the floor, between stations, in what everybody calls "the space behind inspection".
That is the whole problem stated in one number. A hall with 819 shirts standing in it is not short of machines. It is short of somewhere for the work to go. Nothing about a queue tells you where its cause is. A queue forms in front of the constraint. The machine you can see with a pile in front of it is the one that cannot keep up with what arrives, and that is not necessarily the one that is slow.
Six stations and one number to measure them against
Talhouni's hall must deliver 420,000 shirts in 2,000 hours, which is 210 shirts an hour. Every station in the hall is measured against that one number and against nothing else.
Dalia Qutub timed all six over five days.
| Station | People | Minutes a shirt, per person | Share of shirts it sees | Shirts an hour |
|---|---|---|---|---|
| Trim and de-thread | 4 | 0.97 | all | 247.4 |
| Spot cleaning | 2 | 4.10 | 8.4% | 348.4 |
| Final inspection | 5 | 1.36 | all | 220.6 |
| Needle detection | 1 feeder | 0.176 | all | 340.9 |
| Fold, bag and pin | 6 | 1.58 | all | 227.8 |
| Tag and carton | 2 | 0.51 | all | 235.3 |
Two of those need their arithmetic spelled out, because they are the two people get wrong.
Spot cleaning looks tiny and is not. Two people at 4.10 minutes a spotted shirt clean 29.27 shirts an hour between them, and only 8.4% of shirts need spotting. So the station supports 29.27 ÷ 0.084 = 348.4 shirts an hour of hall output. It has more spare capacity than any other station in the building. It is also the most fragile, because it is two people. Send one home sick and the station's rate halves to 174.2, which is below demand, and the hall stops for a reason nobody has on a chart.
The needle detector is the fastest thing in the hall. The machine passes a shirt in a couple of seconds. The limit is the feeder, at 0.176 minutes a shirt, which is 340.9 an hour.
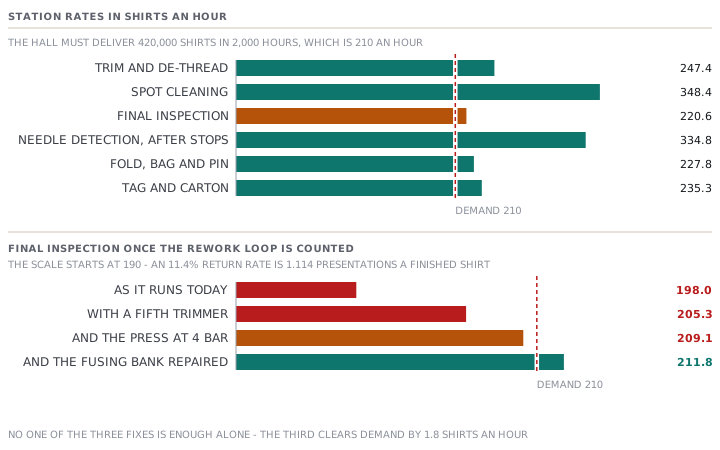
On this table nothing is a bottleneck. The tightest station is final inspection at 220.6 against a demand of 210, which is 5.0% of spare capacity. Every station clears the number. And yet the hall runs late every week, holds 819 shirts, and needs overtime to close the month. So the table is not wrong. It is incomplete: it counts the shirts each station touches, and it assumes each shirt is touched once.
The detector, priced, so the argument can stop
Before the incomplete part, deal with the machine in the room.
Ihab Masri's log records 41 stoppages in March. It is the only station log in the hall, which turns out to matter. Each stoppage is an alarm: the shirt is re-run, then hand-checked, then opened if it alarms again. The average stop is 4.6 minutes.
lost to stoppages  41 x 4.6 min       = 188.6 min = 3.14 hours
March hours        22 days x 8 h      = 176 hours
availability       1 - 3.14/176       = 98.21%
effective rate     340.9 x 98.21%     = 334.8 shirts an hour
334.8 against a demand of 210 is 59.4% of spare capacity, after every stoppage in the log has been counted. The needle detector costs the hall zero hours of output, because work arrives at it at 210 an hour and it drains at 334.8, so any queue it builds during a stop is gone within minutes. A second detector would double the capacity of the station that already has the most to spare.
Two things about the detector are not negotiable, and they cost nothing to say.
Its sensitivity is never reduced to reduce stops. A detector is set against a steel test piece of a stated size, and the setting is a promise to the buyer about the smallest fragment the hall will find. Turning it down converts a visible cost into an invisible one, and that is exactly the swap this whole course argues against.
A failed end-of-shift check invalidates the shift. Talhouni's rule is a test piece at the start and the end of every shift. If the end check fails, everything since the last good check goes through again. That happened once last year: 1,680 shirts, which is one shift at 210 an hour, re-run at 0.176 minutes a shirt. That is 295.7 minutes at USD 0.04 a minute, or USD 11.83. The worst this rule can cost is USD 11.83, which makes it the cheapest insurance in the building, and any argument to soften it is an argument about that much money.
What the log does not record is what the 41 alarms found. It records the alarm and the release, not the object. So the question "how many real needle fragments were in Talhouni's shirts in March?" has the answer unknown, and no amount of re-reading the log will change that. The fix is a column, not an analysis.
What a rework loop does to a station that had enough capacity
Final inspection does not see 420,000 shirts a year. It sees every shirt it rejects a second time.
Over the same five days, Nawal Sabbagh's five inspectors were given 8,824 shirts and returned 1,006 of them, which is 11.4%. Every returned shirt is repaired somewhere upstream and comes back to be inspected again.
inspections per finished shirt = 1 + 0.114 = 1.114
effective rate = 220.6 / 1.114 = 198.0 shirts an hour
198.0 against a demand of 210. There is the bottleneck. It was invisible on the station table because that table counted shirts, and the loop is counted in trips through inspection. Final inspection has 5.0% of spare capacity and an 11.4% return rate, so it is 5.4 percentage points short of being able to inspect its own rework.
Check the other stations the same way, because a loop touches more than one of them. Only the causes that return to a station load that station again.
| Station | Returns it re-does | Rate after the loop | Against 210 |
|---|---|---|---|
| Trim and de-thread | the 412 thread-end returns | 236.4 | clears |
| Spot cleaning | the 118 soil returns, on top of 8.4% | 300.5 | clears |
| The press cell | the 208 mark and 171 pucker returns | 246.5 | clears |
| Final inspection | every one of the 1,006 | 198.0 | short by 12.0 |
| Needle detection | none, the loop is upstream of it | 334.8 | clears |
| Fold, bag and pin | none, the loop is upstream of it | 227.8 | clears |
At 198.0 shirts an hour, 420,000 shirts need 2,121.2 hours against the 2,000 the hall has. That is 121.2 hours of overtime a year, and Talhouni pays finishing overtime at 1.25 times the normal rate: USD 3.00 an hour fully loaded, against USD 2.40.
Energy is metered. The whole hall draws USD 9.40 an hour, and inspection with the stations after it draws USD 2.10.
| People | Hours | Labour, USD | Energy, USD | Total, USD | |
|---|---|---|---|---|---|
| The whole hall called in, which is what happens | 29 | 121.2 | 10,544.40 | 1,139.28 | 11,683.68 |
| Only inspection and the stations after it | 14 | 121.2 | 5,090.40 | 254.52 | 5,344.92 |
USD 6,338.76 a year is the price of calling in the whole hall instead of only the stations that are short. Trimming, spotting and pressing are upstream of the constraint and have already built a buffer by the end of the day. They are working overtime to make more of what is already queueing. That is not a small habit. It is a third of the whole cost of the loop, and it is fixed by a shift roster rather than by a machine.
The four things you could do, and only one of them is the cheapest
For inspection to clear 210 shirts an hour, inspections per finished shirt have to fall below 220.6 ÷ 210 = 1.0504. So the return rate has to come below 5.0%, from 11.4%. That is the target, and it is worth writing down before looking at the options, because every option is then measured against it rather than against "better".
Where do the 1,006 come from?
| Cause | Shirts | Share | Made at | Minutes to repair |
|---|---|---|---|---|
| Loose thread ends | 412 | 41.0% | Sewing, and missed at trim | 1.4 |
| Pressing mark or shine | 208 | 20.7% | The press cell | 1.1 |
| Puckered collar or cuff edge | 171 | 17.0% | Fusing, and the collar press | 1.1 |
| Soil or handling mark | 118 | 11.7% | Anywhere upstream | 4.1 |
| Stitch fault needing a real repair | 97 | 9.6% | Sewing | 9.6 |
| Total | 1,006 | 100% | 2.394 weighted mean |
Add the 1.36 minutes each returned shirt spends being inspected a second time, and a return costs 3.754 minutes, or USD 0.1502. At 11.4% of 420,000 shirts that is 47,880 returns a year and USD 7,191.58 of repair labour. The queue model never shows you that cost, because it is not a delay. It is work.
Option one: a sixth inspector. Six people at 1.36 minutes is 264.7 shirts an hour, which after the loop is 237.6, comfortably above 210. It costs 2,000 hours at USD 2.40, or USD 4,800 a year, and it removes the whole USD 11,683.68 of overtime for a net USD 6,883.68. This works. It is worth saying plainly, because the argument against it is not that it fails.
Option two: a fifth trimmer. Move 0.19 minutes a shirt into the trim station and put a fifth person on it. Five people at 1.16 minutes is 258.6 an hour, still above demand. A two-day trial cut thread-end returns from 412 to 62. Returns fall to 656 of 8,824, which is 7.43%, and inspection's effective rate rises to 205.3. Not enough on its own. Cost: USD 4,800, the same as an inspector.
Option three: put the collar press back to 4 bar gauge, which is lesson 2's finding and has already been done. Pressing marks fall from 208 to 38, returns to 486, which is 5.51%, and inspection reaches 209.1. Still 0.9 short of demand, which is an uncomfortable place to stop.
Option four: repair the fusing heater bank, which is lesson 1's finding and has also already been done. Puckered collar and cuff edges fall from 171 to 51, returns to 366, which is 4.15%, and inspection reaches 211.8. At 211.8 shirts an hour, 420,000 shirts take 1,983.0 hours, inside the 2,000 available. The overtime goes to zero.
Why the more expensive answer is the cheaper one
Both routes clear the queue. They do not leave the same factory behind.
| A sixth inspector | The three upstream fixes | |
|---|---|---|
| Return rate | 11.4%, unchanged | 4.15% |
| Overtime removed, USD | 11,683.68 | 11,683.68 |
| Returns a year | 47,880 | 17,430 |
| Cost a return, USD | 0.1502 | 0.2292 |
| Repair labour a year, USD | 7,191.58 | 3,994.96 |
| New cost, USD | 4,800 | 4,800, the fifth trimmer |
| Net a year, USD | 6,883.68 | 10,080.30 |
The cost a return for the three upstream fixes is worked the same way as for the inspector. With returns at 62 thread ends, 38 marks, 51 puckers, 118 soils and 97 stitch faults, the weighted mean repair is 4.371 minutes. Add the 1.36 minutes of re-inspection and a return costs 5.731 minutes, or USD 0.2292.
The difference is USD 3,196.62 a year, and it is exactly the repair labour the sixth inspector leaves in place. An inspector inspects the same 47,880 defective shirts faster. Nobody upstream changes anything, because nothing upstream has been asked to.
One number in that table moves the wrong way, and it should be read rather than skipped. The cost of repairing an average return rises from USD 0.1502 to USD 0.2292. The defects that were removed are the cheap ones: a thread end takes 1.4 minutes, a real stitch repair takes 9.6. So what is left is a harder mix. Total repair labour still falls by 44.5%, but the rate gets worse, and a factory watching cost per rework rather than total rework would report this improvement as a decline. That is a real trap in the measure.
Check yourselfIhab Masri's successor arrives, reads the station table, and proposes buying a second needle detector and adding a sixth inspector. Using this lesson's figures, what does each one buy, and what would you tell him to do first?Show the answer
The second detector buys nothing at all. The detector runs at 340.9 shirts an hour, or 334.8 once every stoppage in the March log is counted, against a demand of 210. That is 59.4% of spare capacity. Doubling it doubles the capacity of the station that already has the most to spare. The queue in front of it is there because 819 shirts are standing in a hall with 640 places on the rail, not because the detector is slow. The sixth inspector genuinely works: it lifts inspection from 198.0 to 237.6 effective and removes USD 11,683.68 of overtime for USD 4,800, a net USD 6,883.68 a year. But it leaves the return rate at 11.4%, and therefore leaves USD 7,191.58 a year of repair labour in place. The three upstream fixes bring returns to 4.15% and are worth USD 10,080.30, which is USD 3,196.62 more. That is exactly the repair labour the inspector does not touch. What to do first costs nothing: change the overtime roster. Calling in only inspection and the stations after it, rather than the whole hall, saves USD 6,338.76 of the USD 11,683.68 immediately. It needs no equipment and no extra people, and it buys the time to do the other three properly.
Check yourselfSpot cleaning clears 348.4 shirts an hour against a demand of 210 and never appears in any bottleneck analysis. Why is it the station that should worry you most, and what is the cheapest thing to do about it?Show the answer
Because its spare capacity is arithmetic and it depends on two people. The station's rate is two operators at 4.10 minutes a spotted shirt, on the 8.4% of shirts that need spotting. Lose one to sickness, a school run or annual leave and the rate halves to 174.2. That is 35.8 shirts an hour below demand, and the whole hall stops behind a station nobody has ever put on a chart. Once the rework loop is counted, its true load is 9.74% of shirts rather than 8.4%, so the margin is thinner than the headline. The cheapest thing to do is not to hire. It is to train two people at another station to spot, so the second seat can be filled from inside the hall on the morning it is empty. Trim and de-thread is the sensible place to take them from, because it runs at 236.4 an hour after the loop against a demand of 210 and can lose a person for an hour without stopping. The measurement that would settle whether this has ever actually bitten is a station-by-station timing of the 3.9 hours inside, which Talhouni has not done. Today the answer is unknown. A weak point nobody has seen fail is not the same as one that does not exist.
Prompt · Model your finishing hall as station rates against one demand, with the rework loop counted
When the finishing end is late, when somebody wants to buy a second machine for the station with the queue in front of it, or before adding an inspector.
Help me model my finishing hall as a queue rather than as a list of machines.

First establish the one number everything is measured against: my annual output divided by my productive hours, which is the demand in garments an hour. Then for every station take from me the headcount, the measured minutes a garment per person, and the share of garments that station actually sees. Spot cleaning and repair stations see a fraction, and a station rate worked out as if they saw everything is wrong. Give me each station's rate an hour and mark which ones clear demand.

Then do the part that changes the answer. Ask me for my final-inspection return rate, and for the causes broken down by count, with the repair minutes for each cause. Work out inspections per finished garment, divide the inspection rate by it, and re-check every station with only the returns that come back to that station. Tell me which station is actually short and by how much. Then turn the shortfall into hours of overtime a year and price it twice: the whole hall called in, and only the constraint and the stations after it. Tell me the difference, because it is usually large and it costs nothing to fix.

Then give me the options side by side over a year: adding a person at the bottleneck, and fixing each cause upstream. For each one show the new return rate, the new effective rate, whether it clears demand on its own, the overtime removed, the repair labour remaining, and the net. If adding a person at the bottleneck genuinely works, say so plainly rather than arguing against it, and then show what it leaves behind.

Four rules. Do not call a station a bottleneck on the standing chart alone; the loop is what decides it. If a station has the most spare capacity and a written log while the others have neither, say that it is the only one anybody can produce evidence about, and that the others are unmeasured rather than better. Never propose reducing a needle detector's sensitivity or relaxing a shift-end check to reduce stoppages; price the check's worst case instead. And warn me that when the cheap defects are removed, the average cost of a remaining rework rises, so I must watch total rework and not cost per rework.
AI can make mistakes — check anything you act on.