Lessons · Lesson 6 of 6
A fit map shows strain, not comfort
Read a virtual fit map as the physical quantity it computes, and say only what the simulation is entitled to support.
Lesson 6 of 6 · 17 min
What the colours are
A garment simulator lays a flat pattern around a body mesh, sews the panel edges together, applies a material model, and works out the shape the cloth settles into. Then it colours the result by a computed quantity. Most often that is strain — how far the cloth has been stretched from its resting state — or contact pressure, how hard it is pressing on the surface underneath.
That is the whole of it. The colour is arithmetic about cloth. It is not a judgement, and it is not a report from somebody wearing the garment.
Three things the simulation has to be given, and where each one came from
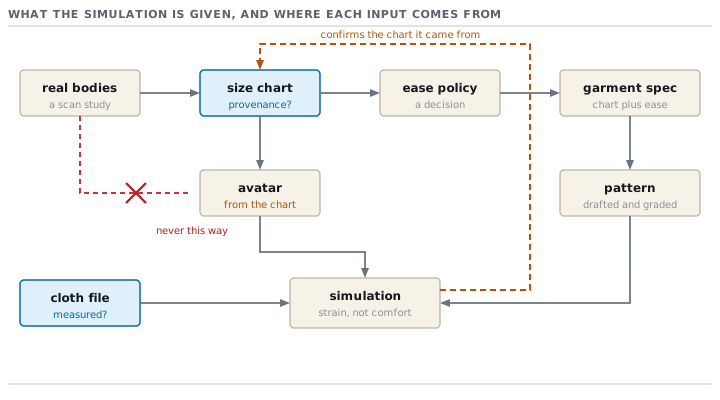
The body. This is the one that decides everything, and it closes the loop this course opened. The avatar is generated from the size chart. A parametric avatar takes girths and lengths as its settings, and those settings come from the same table lesson 1 could not find a source for. So a simulation run on a chart-generated avatar cannot audit the chart. It reproduces it — beautifully, in three dimensions, in colour.
Ostley simulated OS-2214 at size 10 and at size 18. The size-18 avatar was generated from the old chart.
| Input | Value used | Value measured | Effect |
|---|---|---|---|
| Avatar hip | 116.0 | 123.0 | The seat was simulated on a body 7.0 cm smaller than the customer |
| Fabric elongation at 15 N | 22.0% | 14.8% | The cloth was assumed to give 48.6% more than it does |
Both errors point the same way. The map showed the seat clear at size 18. The garment binds.
The cloth. Ostley's material file was a library default named after the fabric type. The actual roll, tested, stretches 14.8% at 15 N across the width against the default's 22.0%. So every strain figure in the simulation was computed on a cloth more forgiving than the one in the container. Testing the real fabric and building the file cost USD 340.00 and 4 days, once, and the file then serves every style made in that cloth. It is the cheapest line in a digital sampling budget and the most often skipped.
The construction. A simulator joins panel edges with a stiffness. It does not know your folder, your fusible, how your seam allowance behaves after pressing, or the elastic your waistband is actually made with. Some of that can be modelled and some cannot, and knowing which is a judgement rather than a setting.
What a fit map is entitled to support
The honest position is that a simulation is a comparison instrument. Two patterns, one avatar, one material file: the difference between them is real and useful. One pattern on one avatar, read as a statement about a person, is not.
| Supported | Not supported |
|---|---|
| Pattern B carries less strain at the seat than pattern A | This trouser is comfortable |
| The side seam falls forward of the leg's centre line | This trouser fits a real size 18 |
| There is surplus cloth above the back waist in this panel | The cloth will behave this way after ten wears |
| The two revisions differ by this much in the same place | The red area is a fault |
Every sentence in the supported column names a comparison and a reference. Every sentence in the other column is an absolute claim about a person, about a garment in use, or a verdict — and none of those is a quantity the solver computed.
The rule that falls out of it
Never let a virtual round replace the last physical evidence about a size no human being has ever worn. Virtual rounds are excellent in the middle of the range, where you already have a fitted base and a fit model, and there they are worth exactly what they cost. At the ends of the range they are running on assumptions rather than observations, and they look just as confident there as they do at the base.
Which gives the two-line policy Ostley now runs. Simulate freely at every size. Physically fit the base and the two extremes, every season, whatever the simulation says. That is four garments and about nine days, and it is the only part of the process that can contradict the chart.
Prompt · Read a virtual fit map without over-claiming
When a 3D report says a style is clear at every size and somebody proposes cancelling the physical size set on the strength of it.
Act as a senior fit technologist who uses garment simulation daily and is sceptical of what it is asked to prove. I want a virtual fit report audited before anybody acts on it. Here is the report and its inputs. Style, fabric and construction: [DESCRIBE THEM]. The sizes simulated: [LIST]. Where the avatar measurements came from: [SIZE CHART, SCAN DATA, A VENDOR LIBRARY, OR UNKNOWN]. If from a chart, the chart itself: [PASTE IT]. If any measured body data exists for these sizes: [PASTE IT]. The material file: [MEASURED ON THIS FABRIC, A LIBRARY DEFAULT, OR UNKNOWN — AND ANY TEST RESULTS I HOLD]. The quantity the map is coloured by: [STRAIN, PRESSURE, SOMETHING ELSE, OR UNKNOWN]. The conclusions the report draws, quoted: [PASTE THEM]. What the report is being used to justify: [SKIPPING A ROUND, CANCELLING A SIZE SET, APPROVING BULK, A PATTERN CHANGE]. Do the following. First, restate what the simulation actually computed, in one paragraph, in physical terms. Second, take each conclusion in the report and sort it into supported, supported only as a comparison against a named reference, or not supported at all — and for each unsupported one, say what it would take to support it. Third, tell me what the avatar's provenance means for what this report can prove. If the avatar was generated from the size chart, say plainly that the simulation cannot test the chart and explain why. Fourth, tell me what a library material file does to strain figures compared with one measured on this cloth, in which direction, and what it would cost me to fix. Fifth, name the areas where the map should be expected to show high strain by design, so nobody removes the design to make a picture look calmer. Sixth, tell me which physical evidence must not be cancelled on the strength of this report, and why, size by size. Do not describe a colour on a map as comfortable, uncomfortable, good or bad.
AI can make mistakes — check anything you act on.
Check yourselfYour 3D team reports that the simulation shows no tension issues at any size, so the size set can be cancelled. What is wrong with the report?Show the answer
It is reporting an absence of evidence as evidence of absence, and the mechanism guarantees the result. The avatars at every size were generated from your size chart, so the simulation is testing the pattern against the chart — the same chart the pattern was drafted from. Agreement between the two is not a finding; it is arithmetic. The simulation could only have shown tension if the pattern had departed from the chart, which is a drafting error and a real thing to catch, but not the thing being claimed. Ask two questions before you accept it. Where did the avatar's measurements come from, and were the material properties measured on this fabric or taken from a library? If the answers are the size chart and a library, the report says the pattern matches the chart, and that is all it says.
What to take to your own virtual fit
- Write down what you expect to be red before you open the map, and why. A map read without a prediction confirms whatever you already believed.
- Measure the fabric and build the material file. It is a few hundred dollars once per cloth, and every simulation in that cloth is worth nothing without it.
- Ask where the avatar came from, every time. If it came from the chart, the simulation cannot test the chart.
- Write your conclusions as comparisons with a named reference, never as verdicts. "Less strain at the seat than revision A" is a finding. "Fits well" is not a sentence the solver is entitled to.
- Keep three physical garments a season: the base and both ends. They are the only part of the toolchain that can tell you something the chart does not already say.