Lessons · Lesson 1 of 3
How many places to hold stock
How a distribution network trades total stock against distance to the customer, and how to price that trade with measured figures instead of a rule of thumb.
Lesson 1 of 3 · 44 min
The programme, the cast, and the basis
Goods that leave the factory still have to reach the person who wears them. Where you keep them on the way is a choice. Most factories make that choice by accident. Hold stock in more places and every customer is nearer to some of it. Hold it in fewer places and you need less of it in total. This lesson prices that trade.
Tikvesh Apparel is a workwear factory in Kavadarci, North Macedonia. It employs 640 people on five sewing lines. It makes industrial trousers, work jackets and polo shirts. Most of its output still leaves on a buyer's own transport. One contract does not, and that contract is this course.
PRG-4408 is a call-off programme for Rothenkamp Services, a European facilities-management group. Call-off means the buyer does not order the whole quantity at once. Rothenkamp's sites order small quantities all year, as people join, leave and change size. Tikvesh holds finished stock in Europe and sends parcels straight to each site. The largest item in the programme is style TK-118, an industrial trouser.
Four people appear.
- Menka Stojanoska runs logistics for the group. She owns the network decision.
- Ilija Trpevski is the plant's finance controller. He owns the cost model in lesson 2.
- Wiebe Doornbos leads the Venlo site, the one warehouse Tikvesh runs itself.
- Ognen Pandev is commercial director. He signs the contract in lesson 3.
Say the basis once, because every figure below depends on it. Money is euros, which is what the programme is priced in. A garment in the programme costs EUR 14.20 at standard cost. The trading year is 50 weeks. Every demand figure and every road distance is measured from Tikvesh's own despatch records. Every rate is a quotation Tikvesh holds for 2027, not a market average.
The network is five demand areas, not five countries
A distribution network is usually drawn as a map with pins in it. That is the wrong picture. What you are really choosing between is a set of service assignments: which demand is served from which place. Countries are where the demand is. They are not where the decision is.
Tikvesh's programme splits into five areas that behave differently. The split comes out of the despatch records, not out of a sales map.
| Area | Garments a week, mean | Weekly standard deviation | Parcels a year |
|---|---|---|---|
| North, being the Netherlands, Germany and Denmark | 14,880 | 3,600 | 49,600 |
| West, being France and Belgium | 9,840 | 2,880 | 32,800 |
| Italy | 4,680 | 1,560 | 15,600 |
| Iberia | 2,520 | 1,040 | 8,400 |
| East, being Poland, Czechia and Slovakia | 6,000 | 1,920 | 20,000 |
| All five | 37,920 | see below | 126,400 |
The standard deviation is how far a normal week sits from the average week. A big one means demand jumps about. Three numbers follow from that table, and they get used everywhere below.
garments a year   = 37,920 x 50 = 1,896,000
garments a parcel = 1,896,000 / 126,400 = 15
pallets a year    = 1,896,000 / 480 = 3,950
A pallet holds 480 garments in cartons. Whatever the network shape, Tikvesh refills each stocking point on a fixed fortnightly cycle. That is 25 consignments a year to each point. The fixed cycle matters later. It means cycle stock — the stock you hold simply because deliveries arrive in batches — is the same in every network. So the whole inventory difference is safety stock.
The row marked see below is what this lesson is about. You cannot add standard deviations together. Adding them is the arithmetic that produces the rule of thumb. It is wrong in the safe direction, which is exactly why the rule is popular.
What pooling is worth, and what a famous rule claims it is worth
Safety stock covers the demand you did not expect, during the time you cannot react. Under a fixed review cycle that time is not the lead time. It is the lead time plus the review period. An order placed today has to last until the order after next arrives.
At Tikvesh the refill lead time is 8 weeks: six weeks for a production slot and two weeks in transit. The review period is 2 weeks. So the protection interval is 10 weeks.
safety stock = z x sigma over the protection interval
             = 1.96 x sigma per week x root 10
root 10      = 3.1622777
The 1.96 gives a 97.5% cycle service level. That is the share of refill cycles that end without running out. It is not a fill rate, and it is not a service promise to Rothenkamp. Say which one you mean, every time. The two numbers are far apart, and people quote whichever is higher.
The square root law
The rule most people carry is this: safety stock moves with the square root of the number of stocking points. Halve the points and you keep about seven tenths of the stock. Go from four points to one and you halve it.
That rule is not folklore. It was set out properly, and its conditions were set out with it. The stocking points must be of equal size, and their demands must be independent of each other. Tikvesh's points are neither. Both failures push the answer the same way.
The correct arithmetic is the variance of a sum. Variance is the standard deviation multiplied by itself, and unlike deviations, variances can be added.
variance of the sum = sum of each variance
                    + 2 x rho x every pairwise product of the deviations
Menka Stojanoska measured how the five areas move together, using four years of weekly despatches. That measure is the correlation. It runs from zero, where the areas move independently, to one, where they move in step. The ten pairs average 0.35, and none of them is below 0.22. The arithmetic below uses that one average on all ten pairs. That is a simplification. It is right for the total and slightly wrong for any single pair.
The correlation is not an accident, and it is not noise. Rothenkamp renews its site contracts on one common annual cycle, and industrial activity moves together across Europe. Demand that shares a cause is correlated, and correlated demand does not pool.
Four network shapes
| Points | Where the stock sits, and what each point serves | Sum of the point deviations | Safety stock, garments |
|---|---|---|---|
| One | Brno serves all five areas | 7,800.41 | 48,347.44 |
| Two | Venlo serves North and West; Brno serves Italy, Iberia and East | 8,779.38 | 54,415.16 |
| Four | Venlo North; Lille West; Bologna Italy and Iberia; Gliwice East | 10,556.59 | 65,430.42 |
| Five | as four, with Zaragoza taking Iberia off Bologna | 11,000.00 | 68,178.71 |
Work one row through, to see that it reproduces. At five points nothing is pooled at all, so the deviations simply add: 3,600 plus 2,880 plus 1,560 plus 1,040 plus 1,920 is 11,000.00. Then 1.96 times 11,000.00 times 3.1622777 is 68,178.71 garments.
At one point everything pools. The five variances add up to 28,456,000. The ten pairwise products come to 46,272,000, and twice 0.35 of that adds 32,390,400. So the variance of the total is 60,846,400, and its square root is 7,800.41.
Now compare the two rules.
square root law, four points to one : saves 50.00%
measured, four points to one        : saves 26.11%
square root law, four points to two : saves 29.29%
measured, four points to two        : saves 16.84%
The rule promises a saving very nearly twice the size of the one the correlation delivers. The arithmetic says something the argument does not, and it matters, because the pooling saving is the argument almost everybody makes for centralising.
The other half of the trade: getting to the door
Every parcel travels from a stocking point to a Rothenkamp site. Tikvesh's carrier prices that leg on distance.
parcel price = EUR 6.40 + EUR 0.021 a kilometreThe distances are averages over a year of real deliveries, weighted by the sites actually served.
| From | North | West | Italy | Iberia | East |
|---|---|---|---|---|---|
| Venlo | 178 | 410 | |||
| Lille | 205 | ||||
| Bologna | 170 | 370 | |||
| Zaragoza | 155 | ||||
| Gliwice | 262 | ||||
| Brno | 760 | 900 | 470 | 1,640 | 330 |
Weight those by parcels, and the network's average haul falls hard as points are added.
one point    : 750.98 km   outbound EUR 2,802,364.00
two points   : 395.45 km   outbound EUR 1,858,640.80
four points  : 210.07 km   outbound EUR 1,366,568.80
five points  : 195.78 km   outbound EUR 1,328,642.80
There is a rule of thumb here too, and it is also wrong. People often assume the average distance inside a served area falls with the square root of the number of points. On that assumption, four points give each point a quarter of the area and half the distance. From 750.98 km that predicts 375.49 km. The measured figure is 210.07 km, which is 44.05% shorter than the rule allows.
The two rules are wrong in opposite directions, and both errors favour centralising. The inventory rule overstates what you save by closing points. The distance rule understates what you lose. A planner using both would centralise on an argument that is overstated twice over.
The reason the distance rule fails here is worth naming, because it is not a defect in the rule. The rule describes points scattered over an even area. Tikvesh's points sit where the demand is heaviest, and that demand is clustered in a handful of industrial regions. Good siting beats geometry. How far it beats it is a property of your own map, not of a formula.
Four networks, priced
Line-haul is the bulk leg from the factory to a stocking point. From Kavadarci it is quoted by the pallet, at a rate that falls as the consignment grows. A consignment over 33 pallets moves as whole truckloads plus a remainder.
| Pallets in one consignment | Venlo | Lille | Bologna | Zaragoza | Gliwice | Brno |
|---|---|---|---|---|---|---|
| 1 to 5 | 128 | 137 | 95 | 148 | 79 | 85 |
| 6 to 12 | 96 | 103 | 71 | 112 | 59 | 64 |
| 13 to 24 | 78 | 84 | 58 | 91 | 48 | 52 |
| 25 to 33, and a full load | 64 | 69 | 47 | 74 | 39 | 42 |
At four points the Venlo consignment is 1,550 pallets a year over 25 cycles, so 62 pallets each time. That moves as one full truck of 33 plus a remainder of 29. Both sit in the top band at EUR 64. So 62 times 64 is EUR 3,968 a fortnight, and EUR 99,200 a year. Do the same for the other points and line-haul comes to EUR 236,350.00.
Two other lines complete the picture. Cycle stock is 37,920 garments in every network, being half of one fortnight of total demand. Storage on the rate card is EUR 9.60 a pallet a week, which on 480 garments to a pallet is EUR 1.04 a garment a year. Capital, obsolescence and stock insurance run at 9.5%, 4.2% and 0.35% of standard cost. Together that is 14.05% of EUR 14.20, which is EUR 1.9951 a garment a year. And each point carries an account and systems charge of EUR 2,900 a month.
| One point | Two points | Four points | Five points | |
|---|---|---|---|---|
| Capital, obsolescence and insurance on stock | 172,112.17 | 184,217.88 | 206,194.42 | 211,677.54 |
| Storage | 89,718.14 | 96,028.57 | 107,484.44 | 110,342.66 |
| Line-haul from Kavadarci | 165,900.00 | 234,450.00 | 236,350.00 | 258,775.00 |
| Parcels to the site | 2,802,364.00 | 1,858,640.80 | 1,366,568.80 | 1,328,642.80 |
| Account and systems charge | 34,800.00 | 69,600.00 | 139,200.00 | 174,000.00 |
| Total | 3,264,894.31 | 2,442,937.25 | 2,055,797.66 | 2,083,438.00 |
Four points wins, by EUR 1,209,096.65 a year over one point.
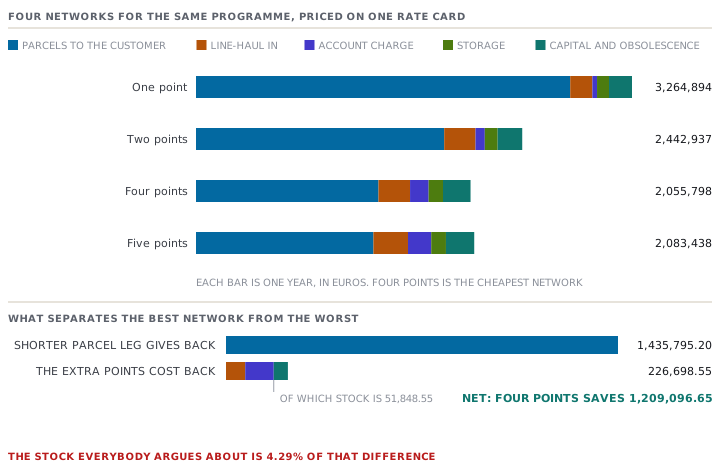
Now look at what decided it. The whole inventory position, capital and storage together, is EUR 313,678.86 at four points and EUR 261,830.31 at one. The difference is EUR 51,848.55. That is 4.29% of the EUR 1,209,096.65 that separates the two networks.
The trade everybody teaches is the smallest term in the equation. The network was decided by the parcel leg. That leg is 66.5% of the winning network's cost, and it moves by more than a million euros across the range. A meeting about whether to centralise will spend its time on stock, because stock is the part with a famous rule attached to it. At Tikvesh the stock argument is worth about four euros in every hundred of the decision.
Is a fifth point worth it
The same arithmetic answers the marginal question, and the marginal question is the one a real network faces. Nobody redesigns from scratch. They ask whether to add one point.
A fifth point at Zaragoza would take Iberia off Bologna. Iberia is 8,400 parcels a year, and the haul falls from 370 km to 155 km.
outbound saved  = 8,400 x 0.021 x (370 - 155) = 37,926.00
line-haul rises =                                22,425.00
account charge  =                                34,800.00
inventory rises =                                 8,341.34
net             = 65,566.34 - 37,926.00        =  27,640.34 more a year
The fifth point loses by EUR 27,640.34. Notice which line kills it. The outbound saving is real and large, and on its own it very nearly covers the worse line-haul rate. What it cannot cover is the flat charge for having a point at all. A stocking point has a price before it holds anything, and that price is the whole of the marginal answer here.
What is still unknown
Two things in this lesson are not measured. Pretending otherwise would throw away the point of the whole exercise.
The first is what a longer haul does to service, as opposed to cost. A parcel from Brno to a Dutch site travels 760 km and arrives a day later than one from Venlo. Rothenkamp has never charged Tikvesh for that day, and Tikvesh has never measured whether it costs Rothenkamp anything. It is unknown. The only way to find out is to ask Rothenkamp what a day is worth to a site with a new joiner and no trousers.
The second is the correlation itself. 0.35 is four years of history, and history is a poor guide to a number that moves when a customer changes its contract cycle. Menka re-measures it every year. If it fell to zero, the pooling saving would rise to 48.1% — and it would still be the smallest term in the table.
Check yourselfA consultant tells Tikvesh that closing three of its four points would cut safety stock by half, and puts a number on it. Using this lesson's figures, is the number right, and does it matter?Show the answer
It is not right, and it does not matter. Those are two separate findings. The square root law assumes stocking points of equal size with independent demand. Tikvesh's points are unequal, and its areas correlate at 0.35. So the measured saving on the sum of deviations is 26.11%, not 50%. Safety stock falls from 65,430.42 garments to 48,347.44, not to 32,715. But the second finding is the one to lead with. Even the whole inventory position, capital and storage together, differs by only EUR 51,848.55 between the two networks, against a total difference of EUR 1,209,096.65. The consultant is arguing about 4.29% of the decision, and getting that 4.29% wrong by a factor of two. The answer is not a better inventory number. It is that the parcel leg rises by EUR 1,435,795.20, and nothing in the inventory line can pay for that.
Check yourselfRothenkamp offers Tikvesh a second programme, half the size of PRG-4408, in the same five areas and running on the same site calendar. Menka wants to know whether the extra volume argues for more stocking points or fewer. What does this lesson say?Show the answer
It argues for more points, and the fifth-point test shows why. Run it again at one and a half times the volume. The outbound saving rises with the parcels, to 12,600 times EUR 4.515, which is EUR 56,889.00. The inventory rise scales too, to EUR 12,512.03. The account charge does not move at all: it is EUR 34,800 whatever goes through the point. And the line-haul rise actually falls, from EUR 22,425.00 to EUR 10,125.00, because the Zaragoza consignment climbs from 10.5 pallets to 15.75 and drops into a cheaper freight band. So the fifth point now costs EUR 57,437.03 against a saving of EUR 56,889.00. It loses by EUR 548.03 instead of EUR 27,640.34. Two things follow. A flat charge per point is what sets the size of a network, so volume moves the threshold. And the freight bands are steps, so the answer does not improve smoothly: at one and six tenths the volume, Zaragoza loses by more again, because Bologna crosses a band before Zaragoza does. Note also what a second programme on the same site calendar does to correlation. It is strongly correlated with the first, so pooling the two buys almost nothing, and the inventory line stays the small term it already was.
Prompt · Work out how many places I should hold stock in
Before opening or closing a stocking point, and any time somebody says centralising will halve the stock.
Help me decide how many places to hold finished stock in, using only my own measurements.

I will give you: my demand areas with a mean and a standard deviation of weekly demand for each, measured over at least a year; the parcels or drops a year each area takes; my replenishment lead time and my review period; my service level and whether it is a cycle service level or a fill rate; my units per pallet; my standard cost a unit; my carrier's outbound price formula; my line-haul tariff by consignment size to each candidate point; the flat annual charge for having a point at all; and the average road distance from each candidate point to the sites it would serve.

First tell me what I am missing, and do not proceed on a guess. If I have not given you the pairwise correlations between my areas, say so and tell me how to compute them from weekly despatch history.

Then build safety stock properly. Use the protection interval, being lead time plus review period, not the lead time alone. Pool by the variance of a sum with my measured correlation, never by the square root of the number of points. Show me both answers side by side and tell me by how much the square root law overstates my saving.

Then price each candidate network on ONE basis: capital and obsolescence on stock, physical storage, line-haul in, outbound to the customer, and the flat charge per point. Give me the total for each and rank them.

Then tell me what actually decided it. Give the inventory difference between the best and worst networks as a percentage of the difference in totals. If it is a small percentage, say plainly that the pooling argument is not the decision here.

Then do the marginal test. For one candidate extra point, give me the outbound saved, the line-haul rise, the inventory rise, and what is therefore left to pay a flat charge with. Express the answer as the highest flat charge at which that point pays.

Three rules. Do not quote me any industry benchmark for stock cover, distance per point or cost per parcel. Every number must come from my measurements or a quotation I hold. Where I have not measured something, write unknown and tell me how to measure it. And never present a service improvement as free because it did not change a cost line I gave you.
AI can make mistakes — check anything you act on.