Lessons · Lesson 3 of 6
Where the delay actually goes
Break the time between an event and the line changing into its three parts, measure each on your own floor, and see which part the quotation is really asking you to buy.
Lesson 3 of 6 · 18 min
"Real time" is a claim about a decision, not about a database
A feed that refreshes every second and a report that arrives tomorrow morning are the same feed if nothing different happens as a result. The only interval that matters is the one between an event and the line changing. It has three parts:
R  =  d  +  w  +  A

d   how long until the number exists
w   how long until somebody with authority sees it
A   how long until the action has an effect on the floor
Every quotation you will ever read prices d. Almost none of them mention w or A. This lesson measures all three on one factory.
What was measured
Over sixty days on Line 4, Ramez logged every station stoppage of ten minutes or more: 34 events. Of those, 9 were at the station setting the line's speed that day, and only those 9 cost the line any output. The other 25 were absorbed by slack somewhere.
That distinction matters as much here as it did in the last lesson. The cost of capture is decided at the constraint, and so is the value of it.
| Segment | Coupons keyed at shift end | Terminals on the line |
|---|---|---|
| Until the number exists | the rest of the shift | 0.7 |
| Until somebody sees it | the morning meeting | 27.5 |
| Until the action has an effect | 26 | 26 |
| Mean productive minutes lost | 266.0 | 53.5 |
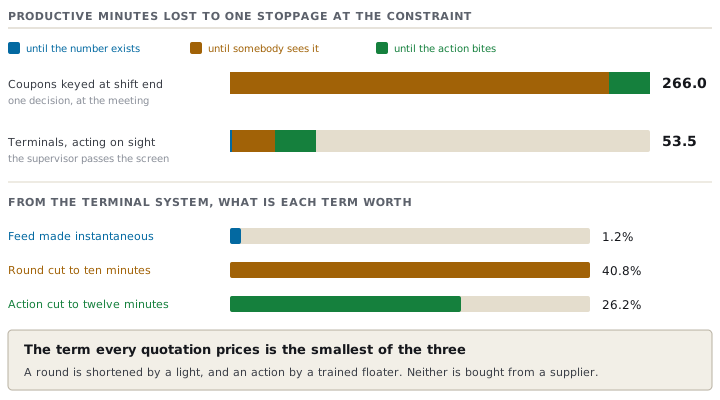
The counting rule that makes those two numbers comparable
Only productive minutes count. An event at 15:10 on a shift that ends at 15:30 costs twenty minutes. It does not cost the fourteen hours until somebody reads a report, because nothing was being lost overnight. Any comparison that counts clock hours will flatter a real-time system enormously, and dishonestly.
On the paper system a decision was taken once a day, at the 07:15 meeting. An event was therefore never fixed inside the shift it happened in. It cost the rest of that shift, a mean of 240 minutes, plus the 26 minutes for the next morning's action to bite. On the terminals, Salwa Serry, who runs Line 4, was told to act on what she saw. She passes the screen roughly every 55 minutes, so on average an event waits 27.5 minutes to be noticed.
What that is worth
While the constraint station is running degraded, Line 4 loses 0.65 pieces a minute. The line runs at 1.7083 pieces a minute, and the affected station drags it down by a bit under two fifths of that.
paper       266.0 minutes  =  172.9 pieces
terminals    53.5 minutes  =   34.8 pieces
saved                          138.1 pieces  =  USD 129.84 an event
constraint events a year, eleven lines            412.5
                                            USD 53,559 a year
That is a genuinely good result, and it is why Line 4's pilot was called a success. Now take it apart, because the number underneath it is not the one anybody thinks.
Which of the three parts is worth buying
Hold the other two still and improve each one in turn, starting from the terminal system's 53.5 minutes.
| Change | Minutes | Improvement |
|---|---|---|
| The feed goes from 0.7 minutes to instant | 52.9 | 1.2% |
| The supervisor's round goes from 55 minutes to 10 | 31.7 | 40.8% |
| The action goes from 26 minutes to 12 | 39.5 | 26.2% |
The term the quotation prices is the smallest of the three, by a factor of more than twenty.
Taking the data from forty-two seconds old to instant buys 1.2%. Putting a light on the supervisor's belt, so she does not have to walk past a screen, buys 40.8% and costs almost nothing. Training a floater who can be dropped onto a station in eight minutes, instead of moving an operator in twenty-two, buys 26.2%. That is a staffing decision with no software in it at all.
Note what the second row really is. It is not a better display. It is the difference between a number that waits to be looked at and a number that goes and finds somebody. It is worth thirty-four times the whole data-speed term.
How to measure your own, this week, with no equipment
Take the last ten stoppages your supervisors can remember or find in a log book. For each one write four clock times: when it started, when the number that showed it existed, when somebody with authority saw it, and when the line actually changed. Ten rows, four columns.
You will not get precision and you do not need it. What you will get is the shape: which of the three gaps is the big one. In most factories it is not the one the project is about. Two of Elmarj's ten rows had w larger than d and A put together. One had an event that was seen within three minutes and acted on ninety minutes later, because the only person who could authorise moving an operator was in a meeting with a buyer.
Check yourselfYour supplier offers to cut the refresh interval from five minutes to five seconds at no extra charge. Is that worth having?Show the answer
It is worth having and it is worth almost nothing, and both are true. Free is free, so take it. But it moves d by two and a half minutes on average, and against this factory's own waiting and acting times it changes the response by about 8%. The danger is not the offer. It is what the offer does to the conversation. Everybody now believes the system got much faster, so the two terms that hold nine tenths of the delay go another year without being measured. Accept it, and put the measurement of w on the same page of the minutes.
Prompt · Break my delay into its three parts
When somebody is quoting for faster data and nobody in the room has measured how long a decision currently takes.
Act as a production manager who is sceptical of real-time projects for good reasons, and can prove why with arithmetic. I want to break down the delay between an event on my floor and the line actually changing. Facts: shift length in productive minutes [NUMBER], line output a day [PIECES], contribution a piece [AMOUNT], the loss rate in pieces a minute while the problem runs unfixed [NUMBER, or ask me how to estimate it]. Here are my last ten disruptive events, each with four clock times: when it started, when the number showing it existed, when a person with authority saw it, and when the line actually changed. [PASTE THE TEN ROWS]. Do the following. First, turn each row into three intervals: time until the number exists, time until somebody with authority sees it, time until the action has an effect. Count PRODUCTIVE minutes only, and explain how you handled events that crossed the end of a shift, because counting clock hours flatters a real-time system dishonestly. Second, give me the mean of each of the three parts and say which is largest. Third, hold two of them still and improve the third in turn, and tell me what each improvement is worth as a percentage of the current response time, and in money a year at my volumes. Fourth, for each of the three, name the cheapest realistic step and say whether it is something a supplier sells or something I can change on Monday for nothing. Fifth, write me one paragraph I can read into a meeting that states what a faster feed alone would and would not change, with the numbers in it. Be blunt where the arithmetic is blunt.
AI can make mistakes — check anything you act on.