Lessons · Lesson 2 of 3
One improvement, run properly — and told apart from luck
Run one change on a real line from first watching to re-measuring, and work out how many days you must watch before a result can be told apart from an ordinary good fortnight.
Lesson 2 of 3 · 38 min
The improvement that worked and made the factory worse
Suppose you change something on a line and the output goes up. You still do not know whether the change did it. A line's output moves about on its own from one day to the next. An ordinary good fortnight looks exactly like a small improvement. This lesson is about the arithmetic that tells the two apart.
In March the industrial engineer did the obvious thing with what lesson 1 had shown him. He could not convert line 6 to cells yet, because the budget was not there, so he took the cheap half. He cut the bundle from 30 pieces to 15. And he put up a standing rule that no station was to hold more than one bundle waiting.
It did exactly what he predicted. The Tuesday count fell from 2,340 pieces to 1,090. Flow time fell from 3.14 days to 1.56 days. The measure the change was aimed at improved by almost exactly the amount forecast, and it stayed improved for the whole fifteen days.
Output over those fifteen days averaged 700 jackets a day against a baseline of 745. Forty-five jackets a day gone. That is 6.0% of the line, USD 54.90 a day at the jacket's USD 1.22 of contribution, USD 824 over the trial.
Nobody made a mistake. The change was correct in its own terms, honestly measured, and it made the factory worse.
What the buffer was being paid for
The engineer had a second measurement running. That is the only reason the cause is known rather than argued about. A helper logged, every day, the minutes during which the last operation on the line had nothing to work on. Call it starvation, measured in line-minutes.
Baseline: 12 line-minutes a day. During the trial: 41.
Twenty-nine extra line-minutes a day, at the line's rate of 1.5521 jackets a minute, is 45 jackets. That is the whole of the loss, accounted for exactly, by a quantity the trial had not been designed to change.
Those twenty-nine minutes had always existed. A thread break at operation 9. A bobbin change at 14. A needle at 21. A mechanic called to 17 and arriving eleven minutes later. On a line of 26 operations the small stoppages never stop arriving. Under the old bundle a station held 90 pieces of work waiting, which is 58 minutes of cover at the line's rate. Under the new rule it held 15 pieces, which is 9.7 minutes. Almost every stoppage used to finish inside the buffer and be invisible. Now most of them reached the end of the line.
Work in process is not free and it is not decoration. It is insurance against variability, bought at a price nobody was quoting. Remove it before you remove the variability and you have cancelled the policy and kept the risk.
The engineer put the bundle size back on the sixteenth day. The correct order of work was now obvious, and it is the rule this lesson is really about: find the largest named source of stoppage, remove it, and only then take away the buffer that was paying for it.
The largest named stoppage, measured
Line 6 runs three colours in a repeating weekly cycle — white, black and slate — so it changes colour three times a week. A white-to-black change means every thread in the building moves. A colour change stops the line while 38 machines are re-threaded: needle threads, loopers, bobbins, and on the overlockers four cones each. Every operator threads their own machine.
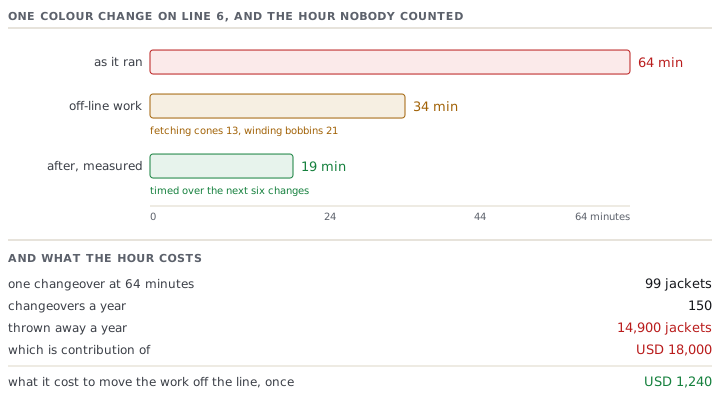
Timed over six changes with a stopwatch: a mean of 64 minutes of line stop, the fastest 51 and the slowest 79.
What that costs is a small multiplication most factories never do. A minute of stopped line is 38 operators earning nothing at 58% against a 14.20 SMV, which is 1.5521 jackets. So
- one changeover at 64 minutes costs 99 jackets;
- three a week, fifty weeks, is 150 changeovers a year;
- which is 14,900 jackets a year, more than USD 18,000 of contribution, thrown away one hour at a time.
Nobody had ever written that number down, because a changeover does not appear in any report. It is not downtime, because the machines are not broken. It is not absence, because everybody is present. It is not a defect. It is simply an hour in which a line that costs the same as any other hour produces nothing.
The change, and it is not clever
The technique has a name, single-minute exchange of die, usually shortened to SMED. The name is the least useful thing about it. The whole of it is one distinction: work that can only be done while the line is stopped, and work that could be done beforehand.
Watching one changeover with a clipboard and splitting the 64 minutes gave:
| What happens | Minutes | Must the line be stopped? |
|---|---|---|
| Operators finish the piece in hand and clear the station | 4 | Yes |
| Fetching cones of the new colour from the store | 13 | No — they can be at the machine already |
| Winding bobbins in the new colour | 21 | No — they can be wound the evening before |
| Re-threading needles and loopers | 19 | Yes |
| First pieces checked and the line settling | 7 | Yes |
Thirty-four of the sixty-four minutes were fetching and winding. Both are work the line does not have to be stopped for. The change was a second set of thread cones for every machine, 120 pre-wound bobbins, and one more bobbin winder — USD 1,240, once. It also took a helper spending 44 minutes the previous evening staging a labelled tray at each machine group, booked as overtime at USD 1.32 a changeover.
Timed over the next six changes: 19 minutes.
The result was better than forecast, which is a reason to be suspicious
The forecast was arithmetic, not hope. Saving 45 minutes a changeover saves 45 times 1.5521, call it 70 jackets. Three changeovers a week is 210 jackets a week, which over five days is 42 jackets a day.
The measurement ran for 24 days before the change and 24 days after. Why that number is the next section. It came out like this.
| Before, 24 days | After, 24 days | |
|---|---|---|
| Changeover, minutes | 64 | 19 |
| Mean output, jackets a day | 741 | 808 |
| Day-to-day standard deviation | 31 | 31 |
| Difference | 67 better | |
| Forecast difference | 42 better |
Sixty-seven against a forecast of forty-two. A factory celebrates that. The right response is to go and find the missing twenty-five. A change that beats its own arithmetic by 60% either had a second effect nobody identified, or is borrowing from something that will not repeat.
It was borrowing. The "after" window sat in weeks five to eight of a style that had started in week one, and line 6 climbs for about ten weeks on a new style. The plan board's own weekly figures put the climb at roughly 25 jackets a day across that window. The changeover work was worth 42. The style was worth 25. Claim 67 and you have promised the plant manager a number you cannot reproduce on the next style, and in ten weeks somebody will ask why it went away.
What a coincidence would have looked like
Line 6's daily output has a standard deviation of 31 jackets. That is ordinary, unremarkable variation: absence, a fabric lot that sews slowly, a Monday.
So before you believe any difference between two periods, ask how big a difference two periods of the same line would show. Take the 24 baseline days, split them at random into two halves of twelve, and compare the halves. The standard error of the difference between two means of twelve days is 31 times the square root of two over twelve, which is 12.66. So a random split of a line that changed in no way at all routinely shows one half beating the other by twenty-five jackets a day.
A twelve-day trial that comes out twenty jackets a day better has told you nothing at all.
The rule of thumb that follows is one division, and it is worth carrying. To see a difference of d jackets a day, with a daily standard deviation of s, watch about
n = 8 times s squared, divided by d squared
days on each side. It is the two-standard-error test written out. It assumes days that vary independently and a spread that does not change, and it is a rule of thumb rather than a statistician's protocol. But it is right within a day or two, and you can do it on the back of the changeover card.
| Improvement you hope for, pieces a day | Days needed each side |
|---|---|
| 100 | 1 |
| 50 | 4 |
| 42 | 5 |
| 25 | 13 |
| 18 | 24 |
| 10 | 77 |
| 5 | 308 |
Read the bottom two rows, then read your own improvement list. A five-piece-a-day improvement cannot be proved in a working year. That is not an argument against making it. Small gains are real and they add up. It is an argument against claiming it. It is an argument against running a programme whose results all sit in the region where the line's own noise is larger than the effect. And against the meeting where six such gains are added together into a number nobody can find in the output.
The 24 days each side came from that table. The forecast was 42, which needs five days. The trial was run at 24 because the engineer wanted to survive a bad week, not because five would not have done. At 24 days the standard error of the difference is 8.95, so the observed 67 is more than seven standard errors out, and the 42 he could attribute is more than four. Neither is luck.
And then the buffer, again
With the changeover work in place, the bundle cut was re-run for another 24 days. Starvation was 19 line-minutes a day rather than 41. The largest named stoppage had been removed, so the buffer had less to absorb. Mean output was 798 against 808 without the cut.
Ten jackets a day. At 24 days the standard error is 8.95, so ten is 1.1 standard errors. The honest statement is that the bundle cut costs somewhere between 28 jackets a day and nothing at all, and no shorter trial will say more than that. Priced at the worst end it is USD 3,050 a year for flow time of 1.56 days instead of 3.14.
The factory kept it, and the reason is the useful part. On line 6 that flow time buys nothing. The ship date is fixed and no tech pack has changed mid-run in four years. On line 9, where Vendhurst changes a trim or a size ratio in the middle of a run most months, two days of work in process is two days of garments made to a superseded specification. What that costs when it is found late is 6.1's subject. The same improvement is worth USD 3,050 of loss on one line and a bargain on the other. Only the order book says which.
Prompt · Design the trial, and tell me how long to run it
The moment somebody proposes a change to a line and somebody else says let us try it for a week and see.
Act as a production engineer who is sceptical by profession and has watched improvement claims evaporate. I want a trial designed properly before I start it, and I want to know in advance how long it must run. Line facts: [LINE], style [STYLE], SMV [MINUTES], [NUMBER] operators, output a day for the last thirty days [PASTE THE DAILY FIGURES IF YOU HAVE THEM, OR GIVE THE MEAN AND THE RANGE]. The change I am proposing: [DESCRIBE IT IN ONE SENTENCE]. What I expect it to be worth, in pieces a day: [NUMBER], and here is how I arrived at that: [SHOW THE ARITHMETIC]. What it costs: [AMOUNT] once and [AMOUNT] recurring. Other things happening on this line during the trial: [NEW STYLE, LEARNING CURVE, ABSENCE, FABRIC LOT CHANGE, OVERTIME, ANY OTHER TRIAL]. Do the following. First, compute the day-to-day standard deviation of my output from the figures I gave you, and if I gave you a range instead, estimate it and say that you did. Second, using the rule that the days needed on each side is about eight times the variance divided by the square of the expected gain, tell me how many days I must watch before and after, and say plainly if the answer is longer than the trial anybody will authorise. Third, list every confound in my list above and say which of them moves output in the same direction as my change — those are the ones that will make my result look better than it is. Fourth, tell me what SECOND measurement I should take alongside output, one that responds to my change directly and is not affected by the confounds. Fifth, write the one-paragraph statement of what I predict, with a number in it, that I will be held to afterwards. Sixth, tell me what result would make me conclude the change did nothing, so that I have written the failure condition down before I start. Do not tell me the change is a good idea.
AI can make mistakes — check anything you act on.
Check yourselfA supervisor reports that a new folder on operation 12 has raised output by 22 pieces a day, measured over eight days. Do you believe it?Show the answer
Not yet, and the reason is arithmetic rather than suspicion of the supervisor. At a daily spread of 31, detecting 22 pieces a day needs about 8 times 961 divided by 484, which is sixteen days on each side. He has eight days on one side and probably no formal baseline on the other. Say so without contradicting him: the folder may well be worth 22, and the way to find out is to keep the folder, keep counting, and look again in a fortnight. What you must not do is add it to a list of savings. The day somebody totals that list against the output figure, none of it will be there.
Check yourselfYour line's daily spread is 31 pieces and you are asked for a programme that delivers 5 pieces a day of improvement every month for a year. What is wrong with the request?Show the answer
Each monthly gain is impossible to prove on its own — 308 days each side — so nobody will ever be able to say whether any single one of them happened. At the end of the year the twelve gains total 60 pieces a day, which IS detectable, so the programme can be judged as a whole and not in its parts. That is a legitimate way to run improvement, but it has to be said out loud at the start. Otherwise every month produces a claim that cannot be checked, and by month seven the numbers on the board and the numbers in the output have separated. Either measure the total and stop reporting the parts, or pick fewer, larger changes.