Lessons · Lesson 1 of 6
The position you already have
Read your factory's real position off the orders it accepted, in contribution per line-day, and see how far it sits from the sentence its owner says.
Lesson 1 of 6 · 18 min
A sentence, and a spreadsheet that disagrees with it
Kelverin is a woven-garment factory. It has fourteen sewing lines and about 640 operators. Ask the managing director, Bahgat Zohdy, what the factory is, and you get four words: we are a workwear factory. He has said it to buyers, to his bank and to two of his own children. He believes it. It is why the factory bought the machines it bought.
In January his costing manager, Milena Wassef, did something nobody at Kelverin had done before. She took every order the factory shipped in the last twelve months. Not quoted. Not enquired about. Shipped. Then she sorted them by the one thing the factory really runs out of: a sewing line, for a day.
This lesson is that spreadsheet, and what it says. It is not flattering. It took an afternoon to build. Every number in it came out of records Kelverin already had.
Why a line-day, and not a piece, a dollar or a minute
Before the table, one decision. It changes the answer.
A factory can rank its work by order value, by pieces, by contribution, or by contribution per line-day. The first three all mislead, and they mislead in the same direction: they reward the work that takes the longest. A big order looks big because it sat in the factory for a long time. That is not a good thing. That is the cost.
The scarce thing is a line for a day. Kelverin has fourteen lines and works 248 days. So it owns 3,472 line-days a year, and it cannot buy a fifteenth line without a building. Every order competes for the same pool. The only fair comparison is what each one returned per unit of that pool.
Contribution here means what is left of the price after every cost that moved with the order: fabric, trims, direct labour, thread, packing, freight where the factory paid it, and the finance cost of the money tied up. It leaves out factory overhead on purpose. Overhead is there whether the line runs or not. Put it inside a per-order number and an idle line starts to look cheaper than a busy one.
Kelverin's year, sorted
| Category | Line-days | Pieces | Order value, USD | Contribution, USD | Contribution per line-day, USD |
|---|---|---|---|---|---|
| Workwear coveralls | 810 | 282,000 | 3,553,200 | 349,680 | 431.70 |
| Workwear multi-pocket trousers | 485 | 256,000 | 2,150,400 | 194,560 | 401.15 |
| Casual five-pocket bottoms | 1,004 | 540,000 | 3,699,000 | 172,800 | 172.11 |
| Chino and flat-front bottoms | 588 | 374,000 | 2,318,800 | 93,500 | 159.01 |
| Hospitality tunics and aprons | 233 | 173,000 | 717,950 | 22,490 | 96.52 |
| Ladies woven blouses | 141 | 57,000 | 450,300 | 9,120 | 64.68 |
| All | 3,261 | 1,682,000 | 12,889,650 | 842,150 | 258.25 |
Three thousand two hundred and sixty-one line-days used, out of 3,472 available. That is 93.9%, with 211 line-days idle. A good year, by the standard most factories judge themselves against.
Now group it. This is where the sentence and the spreadsheet part company.
| Line-days | Share of line-days | Contribution, USD | Share of contribution | Per line-day, USD | |
|---|---|---|---|---|---|
| Workwear | 1,295 | 39.7% | 544,240 | 64.6% | 420.26 |
| Casual bottoms | 1,592 | 48.8% | 266,300 | 31.6% | 167.27 |
| Tunics, aprons and blouses | 374 | 11.5% | 31,610 | 3.8% | 84.52 |
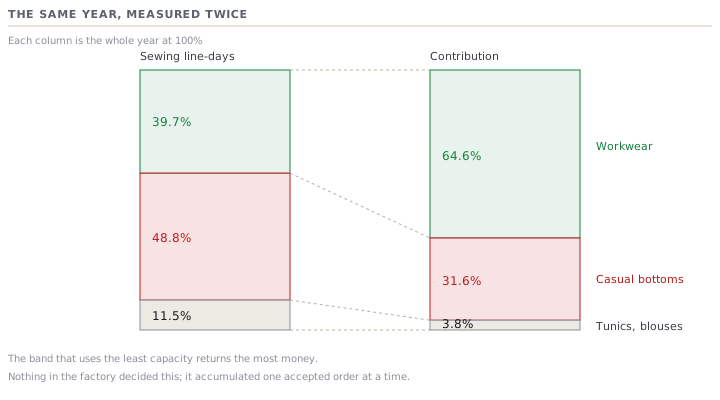
The workwear factory spends 39.7% of its lines on workwear. It spends 48.8% on casual bottoms, a category Zohdy has never once used to describe the business. That half of the year returns 31.6% of the money. A workwear line-day returns USD 420.26. A casual-bottoms line-day returns USD 167.27, which is 39.8% of it.
Nobody decided this. There was never a meeting where Kelverin agreed to become a casual-bottoms factory with a workwear side line. It happened one accepted order at a time. And every one of those acceptances looked right on the day it was made.
What a position actually is
This is the point of the whole course, so here it is flatly.
A factory's competitive position is not what its owner says. It is not what its capability pack claims. It is not what its quote sheet shows. It is the average of every order it accepted, weighted by the capacity each one ate. You have a position whether you chose it or not. Kelverin's is a mid-priced maker of woven bottoms that also does workwear, and it has been that for at least two years.
Three things get mistaken for a position. Each is a different mistake.
The capability list is an inventory, not a position. Fourteen lines, a seam-sealing machine, a certificate and six export markets describe what a factory can do. A position is about what it is chosen for, and that is a fact about buyers, not about machines. Course 14.5 takes a capability pack apart against the screen a buyer really runs. The finding there is the same shape: most of what a factory says about itself is never scored at all.
The quote sheet is a record of intent, not of outcome. It says what the sales desk tried to win. Course 26.6 shows how to read one by category and sort the losses by gap. That is the right way to find where you are structurally uncompetitive. It answers where do we lose. This lesson answers a different question: where did we end up. The two disagree more often than not, because a factory quotes what it is asked for and accepts what it is offered.
The owner's sentence is a memory. It is usually true about the founding, the machines and the emotional centre of the business. It is rarely true about last year.
The number that looks like the answer, and is not
The obvious next move is to price the swap. If the 1,592 casual-bottoms line-days had earned what a workwear line-day earns:
1,592 line-days x USD 420.26  =  USD 669,058
actually earned                =  USD 266,300
difference                     =  USD 402,758
USD 402,758. It is a real calculation and it is nearly useless. It assumes a workwear order was waiting for every casual one. There was not. Kelverin quoted 34 workwear enquiries in the year and won 21. There were no more workwear enquiries in the building to accept.
So the honest reading of USD 402,758 is not money we lost. It is the size of the prize for a sales problem. It tells you how hard the enquiry gap is worth working on. It is not a production problem and it is not a costing problem.
There is a harder point underneath it, and the rest of the course exists to settle it. The alternative to a casual-bottoms line-day was not a workwear line-day. It was an idle line-day, which earns nothing at all. Judged against idle, every one of those 1,592 line-days was the right call. Judged against a factory that went out and found workwear enquiries instead, none of them was. Which comparison is correct depends on numbers Kelverin has not measured yet. That is lesson 4.
Check yourselfYour biggest customer by order value is 30% of your turnover. Why does that not tell you whether it is your best customer?Show the answer
Because order value measures how much of your factory it ate, not how well it paid for it. Divide its contribution by the line-days it occupied, and compare that with your other customers. Turnover share tells you how exposed you are if it leaves, which is a real and separate question. It says nothing about whether you would replace it with the same work or with better work.
Prompt · Read my revealed position off my own accepted book
Before any conversation about strategy, and before anyone in your company says a sentence beginning 'we are a'.
Act as a factory analyst. Build my REVEALED position from the orders I actually shipped. Use only the numbers I give you. Do not fill any gap with an industry assumption, a benchmark or a country statistic. Where I have not given you a number, write UNKNOWN and tell me how to measure it from records a factory already keeps. My constraint resource is [LINE-DAY / MACHINE-HOUR / LAUNDRY-DAY], I have [NUMBER] of them a year, and I used [NUMBER] last year. For each category I shipped in the last twelve months I will give you: category name, the units of that constraint it used, pieces, order value, and contribution after every cost that varied with the order (leaving out factory overhead, and say so if my figure includes it). Here are my categories: [LIST]. Now do six things. First, lay out one row per category with contribution per unit of the constraint, sorted worst to best, and show my factory average. Second, give me each category's share of capacity beside its share of contribution, and tell me the largest gap between the two. Third, tell me in one sentence what my revealed position is, phrased the way a buyer would describe me rather than the way I would describe myself. Fourth, compare that with the sentence I would use, which is: [YOUR SENTENCE]. Fifth, price the swap. Work out what my worst category's capacity would have earned at my best category's rate. Then state plainly why that number is NOT a loss, and what it is the size of instead. Sixth, list the three measurements I am missing that would most change this answer. Do not recommend anything yet. The decision needs an enquiry book I have not given you.
AI can make mistakes — check anything you act on.