Lessons · Lesson 5 of 6
Two books, one margin, opposite endings
Compare two order books with the same costed margin under the same week of cancellations, and find the figure that separated them in March.
Lesson 5 of 6 · 20 min
The book Zerrand could have had
Every enquiry Zerrand turns down is logged, because the planner has to record why a week was refused. That log is the most under-used document in the building. It lets us do something a factory almost never gets to do: build a second order book out of orders that were genuinely available, and run the same September through both.
Book B below is made entirely of real enquiries from that season. Vintry Hall's parka, Ternhill's workwear contract and Ospreyfield's spring rainwear stay, because they were the strongest three. Everything else is replaced by something Zerrand was offered and turned down.
| PO | Buyer | Product | Group | Units | FOB | Order value | Margin |
|---|---|---|---|---|---|---|---|
| VNH-3106 | Vintry Hall | women's padded parka | autumn outerwear | 26,000 | 44.00 | 1,144,000 | 134,940 |
| KLV-402 | Kelvenn Outdoor | fleece-lined shell | autumn outerwear | 18,000 | 43.90 | 790,200 | 96,480 |
| SDM-2094 | Sundermere | school coat | autumn outerwear | 18,000 | 26.00 | 468,000 | 42,660 |
| TNH-118 | Ternhill Group | softshell work jacket | workwear contract | 28,000 | 42.50 | 1,190,000 | 159,600 |
| OSF-780 | Ospreyfield | spring rain jacket | spring rainwear | 8,000 | 37.00 | 296,000 | 41,440 |
| WRN-96 | Wrenmoor Schoolwear | school blazer | uniform, January | 46,000 | 24.50 | 1,127,000 | 98,440 |
| YRL-311 | Yarralen Outdoor | insulated jacket | southern autumn | 21,000 | 51.00 | 1,071,000 | 137,550 |
| 6,086,200 | 711,110 |
For practical purposes the two books are the same size. Book A is USD 6,099,990 of value against Book B's USD 6,086,200, a difference of 0.23%. Book A is costed to make USD 711,218 and Book B USD 711,110, a difference of USD 108, which is 0.015% of either.
On every number a factory usually looks at, these two books are identical. Same turnover, same profit, same seven orders, same nine lines.
The one thing that changed: the southern jacket
Look at YRL-311 before going further. It is the row that does the most work, and the one a merchandiser would never think of as a risk decision.
Yarralen Outdoor sells outdoor clothing in a market whose autumn is Zerrand's spring. It buys the same product Zerrand already makes: an insulated jacket, the same construction, the same skills, a similar price. It is not a move into something new, and it needs no new capability. It is the same garment sold into a season that cannot be warm at the same time as the northern one.
For an outerwear factory the strongest way to spread risk is usually not a different customer and not a different product. It is a different half of the world, and it costs one sales trip.
One stress test, applied to both
To compare the two books fairly, the shock has to be the same shock, applied by the same rule, with nothing tuned to favour either. So the rule is taken from what actually happened in lesson 3, not invented:
- Only orders in the autumn outerwear, Northern Europe, retail group are affected.
- 18.4% of each affected order's units are cut. That is the share of Book A's affected units that the four September calls actually removed.
- On every cut unit, Zerrand loses the margin plus 44.2% of the unit cost. That is Book A's own measured position in September: about 76.0% of unit cost committed at the moment of the call, of which 41.8% came back.
Before using a rule, check it against the event it came from. Applied to Book A, the rule gives a loss of USD 427,596.06 against the USD 415,568.53 that actually happened. The two are 2.9% apart. That is close enough to trust, and it is stated here so you can reject it.
| Book A | Book B | |
|---|---|---|
| Costed margin | 711,218.00 | 711,110.00 |
| Value in the affected group | 4,613,990 | 2,402,200 |
| Share of the book in that group | 75.64% | 39.47% |
| Loss under the stress rule | 427,596.06 | 223,456.96 |
| Margin surviving | 283,621.94 | 487,653.04 |
| Share of costed margin surviving | 39.9% | 68.6% |
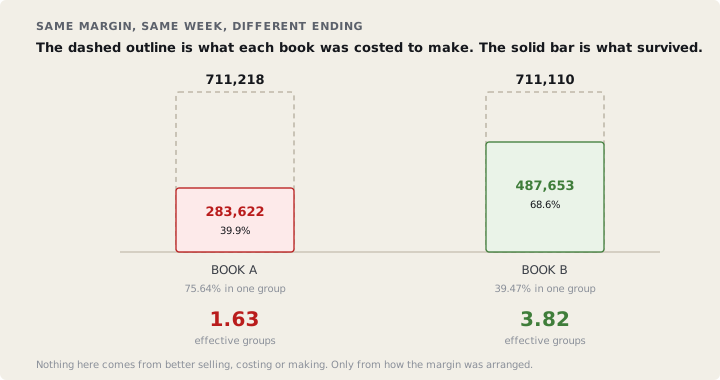
USD 204,031.10 separates them, which is 28.7% of the season's whole costed margin. Not a cent of it comes from better selling, better costing, better negotiating or better making. It comes from how the same amount of margin was arranged.
Why the difference is so nearly proportional
There is no cleverness hidden in the arithmetic. It is worth showing that, so the result does not look like a trick.
The affected value is 4,613,990 against 2,402,200, a ratio of 1.921. The losses are 427,596.06 against 223,456.96, a ratio of 1.914. They are almost the same number because the rule takes a fixed share of each affected order. So the loss is very nearly proportional to how much of the book sits in the affected group. The different margin rates inside it have only a small effect.
That is the practical conclusion. The group's share of the book is what predicts the loss, and you do not need a stress model to read it. Book A's 75.64% and Book B's 39.47% could both have been worked out on 30 April with the arithmetic in lesson 2. The effective numbers were 1.63 against 3.82.
Now compare the customer figures for the same two books: 4.82 effective buyers against 6.10. A modest improvement, in the direction you would expect, and nowhere near big enough to predict a gap of a quarter of a season's profit. The measure that would have told Zerrand what was coming is the one nobody was running.
The honest half: Book B is the worse book in a normal year
If Book B were simply better, the comparison would not be interesting. It is not simply better, because its spread comes with a bill.
- More fabric qualities. Book A runs on three shell qualities. Book B runs on seven. Zerrand's own six-season record shows average line efficiency falling about 1.4 points for every quality above four in a window. So Book B plans at 74.2% against Book A's 78.4%. Over the 106 line-weeks the book occupies, 4.2 points is 4.452 line-weeks of lost output, worth USD 29,871.14 at the book's own margin per line-week.
- More new accounts. Kelvenn, Wrenmoor and Yarralen are all first orders. On Zerrand's record, the sampling, approval work and first-order supervision for a new account cost about USD 12,960 that no order pays for. That is USD 38,880 across the three.
The total extra cost — the premium you pay for the spread — is USD 68,751.14 a season, every season, whether or not anything goes wrong. It is a real number, and a planner is right to raise it.
So the question becomes arithmetic rather than argument. Paying 68,751.14 a year to gain 204,031.10 in a bad autumn is worth doing if a bad autumn happens more often than 33.70% of the time. Zerrand's own record is 3 bad autumns in the last 11, which is 27.3%.
On its own record, Book B does not pay. The spread costs more than the protection is worth. And a merchandiser who has just been persuaded of everything in this course would have bought it anyway.
What to do with that answer
The right response is not to abandon the spread. It is to cut the premium, because the premium and the protection are not the same purchase.
Look at where the 68,751.14 comes from. Almost half of it is the fabric-quality penalty. When Zerrand's technical manager was asked, two of the three extra qualities turned out to be avoidable. Kelvenn's fleece-lined shell can be built on the same three-layer laminate as Ospreyfield's. Yarralen's insulated jacket can use the same shell as Vintry's parka. Only Wrenmoor's blazer cloth is genuinely different. Bring those specifications together and the book runs on four qualities. The efficiency penalty disappears, and the premium falls to the USD 38,880 of new-account cost.
At that price the break-even is 19.06%, against a record of 27.3%. The same spread, the same protection, and now it pays.
Spread across what fails. Converge on what costs. Seasons, end markets and hemispheres are what make orders move together, and spreading across them is nearly free. Fabric qualities, machine types and new accounts are what make a book expensive to run, and spreading across those buys you nothing at all.
Prompt · Run one bad week through my book, and through the book I turned down
When you are choosing between orders for next season, and everything on the table has an acceptable margin.
Act as a factory finance manager who prices cancellations rather than describing them. I want one bad week run through two order books. Facts: Book A is what I have booked — [PASTE THE ROWS: buyer, product, group, units, price, costed margin, ship window]. Book B is built from enquiries I actually received and declined — [PASTE THE ROWS in the same shape]. On average [PERCENT] of my unit cost is committed by the time a cancellation call arrives, and my own record of recovery by stage is: fabric on order [PERCENT], fabric delivered and uncut [PERCENT], cut [PERCENT], finished [PERCENT]. Do the following. First, confirm the two books are comparable: give me total value and total costed margin for each, and the percentage difference between them. If they are not comparable, say so and stop. Second, define one shock and apply it identically to both: name the group affected, cut [PERCENT] of the units of every order in that group, and price each cut unit as the margin given up plus the share of committed cost that is not recovered. Third, give me a table of costed margin, loss and surviving margin for each book. Fourth, tell me what share of each book sits in the affected group, and show me how closely the ratio of the losses matches the ratio of those shares. Fifth, price the cost of the spread: count the extra fabric qualities, the extra new accounts and the extra delivery windows in Book B, put a number on each from the figures I give you, and add them into an annual premium. Sixth, divide that premium by the gain to give me the break-even probability. Then ask me for my own record of how often such a season has happened, rather than assuming one. Seventh, tell me which part of the premium buys no protection at all and could be removed.
AI can make mistakes — check anything you act on.
Check yourselfThe stress rule holds the recovery rate at 41.8% for both books. Does that flatter Book B or understate it, and why?Show the answer
It understates Book B. Recovery is set by the stage an order has reached. Book A's affected orders were all in one delivery window, so on the day of the calls they were all standing at the same late point. Book B's four groups ship across the year, so a September shock would find its affected orders spread across production rather than bunched at the expensive end. Lesson 3 showed that moving the same units to an earlier stage cut the loss to 28.8% of what it was. Holding recovery constant is the cautious choice, which is why it was made.
What to take away
Two books with the same margin can differ by a quarter of a season's profit. The difference is visible in April, in a figure that takes ten minutes to work out. The spread has a real price, and you should name it and pay it knowingly. But most of that price is usually bought by accident, in fabric qualities and new accounts the protection never needed. Spread across what fails. Converge on what costs.