Lessons · Lesson 2 of 3
The listing you do not own
Read a marketplace listing from the outside. Measure what a broken size run does to a page you cannot see inside, use your own site as the control, and price a promotion that competed with itself.
Lesson 2 of 3 · 38 min
A page with somebody else's rules
On your own website you decide what a shopper sees first. On somebody else's marketplace you do not. Your goods are placed by a rule the owner will not show you. You can only study that rule from the outside, by watching what happens to you. This lesson watches one thing that is entirely inside the seller's own control: how many of a garment's colour and size combinations a customer can actually buy today.
On halvergate.com, Idris can put the Farrowby wherever he likes. On the marketplace he cannot. The category page is somebody else's shelf. The order is set by a rule he cannot read, and his listing takes whatever position the rule gives it.
What he does know is what every seller knows, because the platforms publish it in general terms and it is the same everywhere. A marketplace ranking blends availability, price competitiveness, review volume and rating, fulfilment reliability — despatching on time and not cancelling — and content completeness, meaning whether the listing has the attributes and images the category expects. Those are the inputs. The weights are not published. They differ by category, and they change.
Eighteen variants, one listing
The Farrowby is one listing carrying eighteen variants: three colours in six sizes. Availability, whatever weight the platform puts on it, is a property of the listing. A shopper who wants a 12 in navy and cannot get one has met a listing that did not deliver, and the listing carries that.
So Idris measures coverage — how many of the eighteen are buyable — beside everything else, week by week. He can see his position by searching for his own term every day and recording where he lands. Impressions, clicks and units come out of the seller reporting.
| Week | Variants buyable | Average position | Impressions | Clicks | Net units | Own site, net units |
|---|---|---|---|---|---|---|
| 1 | 18 | 4.2 | 51,600 | 3,612 | 268 | 130 |
| 2 | 18 | 4.6 | 50,100 | 3,507 | 248 | 124 |
| 3 | 16 | 5.1 | 46,700 | 3,176 | 233 | 120 |
| 4 | 13 | 7.8 | 35,800 | 2,255 | 152 | 117 |
| 5 | 10 | 11.4 | 24,900 | 1,494 | 93 | 111 |
| 6 | 8 | 14.9 | 17,800 | 1,015 | 60 | 109 |
| 7 | 16 | 6.3 | 34,700 | 2,256 | 164 | 105 |
| 8 | 15 | 6.8 | 33,100 | 2,118 | 156 | 95 |
Between weeks 3 and 6 the size run broke. The middle sizes sold through, the reorder was fourteen weeks away, and ten of the eighteen variants went dark. In week 7 a colour that had been held at the port cleared customs, sixteen variants came back, and the position recovered — most of the way.
The rates behind those columns are where the separate mechanisms show up.
| Week | Coverage | Click-through | Conversion |
|---|---|---|---|
| 1 | 100.0% | 7.00% | 7.42% |
| 2 | 100.0% | 7.00% | 7.07% |
| 3 | 88.9% | 6.80% | 7.34% |
| 4 | 72.2% | 6.30% | 6.74% |
| 5 | 55.6% | 6.00% | 6.22% |
| 6 | 44.4% | 5.70% | 5.91% |
| 7 | 88.9% | 6.50% | 7.27% |
| 8 | 83.3% | 6.40% | 7.37% |
Three things fall at once, and they are three different things.
- Impressions fall because the listing is ranked lower, so fewer people are shown it.
- Click-through falls because a lower position is a worse position. The same listing at rank 14.9 is clicked less often than at rank 4.2.
- Conversion falls because a shopper who arrives wanting a 12 and finds no 12 does not buy. This one has nothing to do with the ranking at all. It would happen on a page with no ranking whatsoever.
They multiply together. Week 1 was 51,600 × 7.00% × 7.42% = 268.0 units. Week 6 was 17,800 × 5.70% × 5.91% = 60.0. Take them one at a time, in that order:
- Impressions alone, holding the two rates at week 1: 17,800 × 7.00% × 7.42% = 92.5 units. Lost: 175.6.
- Then click-through: 17,800 × 5.70% × 7.42% = 75.3. Lost a further 17.2.
- Then conversion: 60.0. Lost a further 15.3.
Total 208.0, which is 268 − 60. The split depends on the order you take the terms in. That is a property of the arithmetic, not of the business. A breakdown like this gives the overlap between the terms to whichever one you apply first. So report it as a ranking of the three effects. Never report it as three numbers you would defend to two decimal places.
Using your own site as the control
The obvious next move is to say week 6 lost 208 units against week 1, and put a price on that. It would be wrong. Week 6 is later in the season than week 1, and there is no reason to think demand was the same.
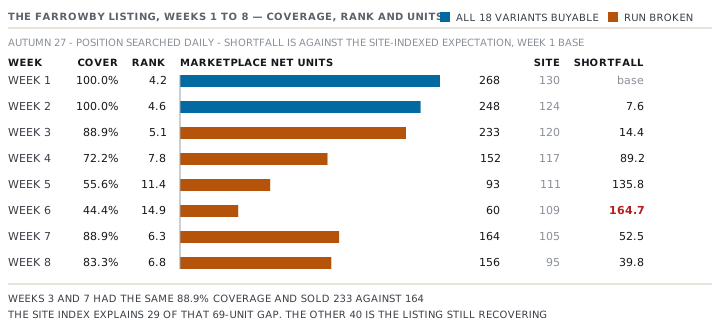
Halvergate has a control sitting in the last column of that table: its own site, selling the same jacket in the same season, ranked by nobody. A control is a comparison that is exposed to the season but not to the thing you are testing. The site index is the site's units divided by its week-1 units. Multiply week 1's marketplace units by that index and you have what the marketplace should have done if nothing but the season had changed.
| Week | Site index | Expected marketplace units | Actual | Shortfall |
|---|---|---|---|---|
| 2 | 95.4% | 255.6 | 248 | 7.6 |
| 3 | 92.3% | 247.4 | 233 | 14.4 |
| 4 | 90.0% | 241.2 | 152 | 89.2 |
| 5 | 85.4% | 228.8 | 93 | 135.8 |
| 6 | 83.8% | 224.7 | 60 | 164.7 |
| 7 | 80.8% | 216.5 | 164 | 52.5 |
| 8 | 73.1% | 195.8 | 156 | 39.8 |
Week 2 is the calibration, and it is the most useful row in the table. Coverage was full, nothing was wrong, and the method still reports a shortfall of 7.6 units. That is the method's noise floor: the size of answer it produces when the true answer is nothing. Week 6's 164.7 is 21.7 times it, and that is what lets Halvergate say the week-6 figure is a real signal rather than an artefact of the method.
At the marketplace's contribution of GBP 38.58 a net unit:
- Weeks 3 to 6, while the sizes were out: 404.1 units, GBP 15,590.18.
- Weeks 7 and 8, after the stock came back: 92.3 units, GBP 3,560.93.
- Total 496.4 units, GBP 19,151.11.
18.6% of the loss happened after the shelf was full again. Coverage recovered in week 7 and the listing did not. Whatever the ranking is reading, it has a memory. A listing that stopped selling is a listing with a worse recent record, and it takes weeks of selling to write that record back. This is the single most useful thing in the lesson, because it changes the sum you do when you are deciding whether to rush a reorder through. The cost of a stockout on a ranked page is the stockout plus the recovery, and the recovery is not free.
Week 9: the promotion that competed with its own listing
In week 9, the week commencing 18 October 2027, Halvergate ran a mid-season event: 20.0% off across its own site. The Farrowby fell from GBP 120.00 to GBP 96.00 there. It stayed at GBP 120.00 on the marketplace, where the price was fixed for the phase.
Price competitiveness is one of the ranking inputs. The identical jacket was now cheaper somewhere else, from the same seller.
| Week 8 | Week 9 | Contribution per net unit | |
|---|---|---|---|
| Own site, net units | 95 | 320 | GBP 50.97 then GBP 32.45 |
| Marketplace, net units | 156 | 61 | GBP 38.58 |
| Own site contribution | GBP 4,842.15 | GBP 10,384.00 | |
| Marketplace contribution | GBP 6,018.48 | GBP 2,353.38 |
The site gained GBP 5,541.85. The marketplace lost GBP 3,665.10. The event made Halvergate GBP 1,876.75.
The trading report said GBP 5,541.85, because the trading report is a report about the site. That was 2.95 times what the business actually made, and the difference was sitting in a channel report nobody read in the same meeting.
Two honest qualifications, one in each direction.
The marketplace fall cannot be pinned down cleanly. The site is the thing being tested here, so it cannot also be the control. Halvergate used week 8 as its comparison, on the grounds that coverage was unchanged at fifteen variants. That is weaker than the site-index method above. The cheap way to settle it is to run the next event with the marketplace price matched, and compare the two events.
The gain is not all a gain either. Some of the 320 units are people who would have paid GBP 120.00 on the site later in the phase, and every one of those costs GBP 50.97 − GBP 32.45 = GBP 18.52. Halvergate has not measured how many, and cannot from the data it keeps. But it can find the point where the answer stops mattering:
The event lost money if more than 31.7% of its 320 units would have bought at full price anyway.
GBP 1,876.75 ÷ GBP 18.52 = 101.34 units, which is 31.7% of 320. That is not a comfortable margin. A third of an event's volume being pulled forward from full price is not an extreme assumption for a mid-season discount on a jacket in October. Halvergate should say plainly that it does not know whether this event made money.
Check yourselfWeek 2 shows a shortfall of 7.6 units against the site-indexed expectation, in a week when all eighteen variants were buyable. Should Halvergate investigate it?Show the answer
No. That is the point of the row. With coverage full and nothing wrong, the method still reports 7.6 units. That tells you the method's own accuracy is around that size, and that any shortfall of a similar size cannot be told apart from noise. Week 3's 14.4 is only twice it, and should be treated as suggestive at most. Week 6's 164.7 is 21.7 times it. A measurement with no noise floor cannot tell you which of its own outputs to believe, and the cheapest noise floor is a period where you already know the answer is nothing.
Check yourselfIdris argues that the GBP 3,560.93 lost in weeks 7 and 8 proves the marketplace ranking punishes sellers unfairly, and that Halvergate should sell less through it. What is wrong with the argument, and what is right about the observation?Show the answer
The observation is right and the conclusion does not follow. What weeks 7 and 8 show is that recovery is slower than restocking. That is a real cost, and it belongs in the sum whenever somebody prices rushing an order through. But it is a cost of running out of stock on a ranked page, not a cost of the page itself. The same eight weeks with the sizes in stock would show none of it. What it argues for is better size-run management on the styles that carry the marketplace's volume, not less marketplace. And the number itself is a floor, because the site control shares the stockout.
Prompt · Read a listing I cannot see inside
When units on a marketplace listing have fallen and nobody can tell you whether it is the ranking, the season or an empty size.
Help me read a marketplace listing from the outside. Treat the ranking as a black box. I cannot see the weights, they differ by category and they change, so we measure the OUTPUT and never try to model the rule.

I will give you, week by week: how many of my variants were buyable, my average position from searching my own term every day, impressions, clicks and net units. I will also give you the net units of the SAME product on a route nobody ranks, usually my own site.

First, turn the counts into rates. Coverage is buyable variants over total variants. Click-through is clicks over impressions. Conversion is units over clicks. Show me that impressions, click-through and conversion are three separate mechanisms, and say which of them has nothing to do with the ranking at all.

Second, break the fall down one term at a time. Then WARN me in the same breath that the split depends on the order the terms are taken in. Report it as a ranking of three effects, never as three numbers I could defend.

Third, build the control. Index the unranked route to its base week, multiply my base-week marketplace units by that index, and give me expected, actual and shortfall for every week. Identify the calibration week — one where nothing was wrong — and call its shortfall the NOISE FLOOR. Tell me which weeks clear it by a wide margin, and which cannot be told apart from noise.

Fourth, split the loss into the weeks the stock was out and the weeks AFTER it came back. Give me both totals, in units and in contribution. The recovery half is the number people forget when they price a rushed reorder.

Then state the limits without being asked. My control shares the stock pool, so the total is a FLOOR, not an estimate. Say what the answer becomes if the base week is moved. And say that coverage falling alongside rank is a link with a believable mechanism, not a cause, until somebody runs the matched-listing test. If I ran a promotion on one route while the other held its price, price BOTH routes in the same sum, and tell me how much the single-route report over-claimed.
AI can make mistakes — check anything you act on.