Lessons · Lesson 3 of 6
- 01 · A settlement, not a measurement
- 02 · Which submeter to buy first, and which one never to buy
- 03 · The interval that sets the price, and the window that proves the change
- 04 · The leak nobody hears, and the saving that grows back
- 05 · One fault, three bills, and nobody who owns it
- 06 · What the programme actually paid for
The interval that sets the price, and the window that proves the change
Compute the smallest change each comparison window can prove, and separate a load that was moved from a load that was removed.
Lesson 3 of 6 · 17 min
One half-hour in March
Zarqun's maximum demand charge for March was USD 22,156.80. It was set by a single half-hour: 07:00 to 07:30 on 11 March, when the site averaged 2,308 kW.
There are 1,440 half-hours in a thirty-day month. One of them — 0.0694% of the month — decided a fifth of that month's electricity account. Nothing else in those 1,440 half-hours mattered to that line at all.
Now look at what Rasha's reporting could see of it before the half-hourly feed was installed.
| What the number is | Reading |
|---|---|
| The settlement half-hour, 07:00 to 07:30 | 2,308 |
| The hourly average, 07:00 to 08:00 | 2,077 |
| That day's average over 24 hours | 1,924.2 |
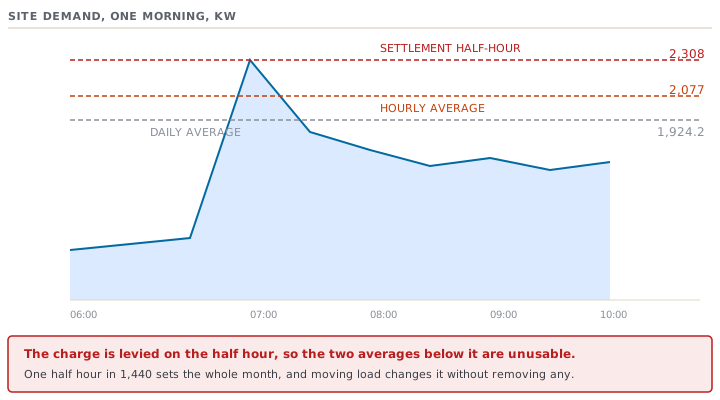
The hourly average is 10.01% below the number that was charged, because the second half of that hour was quiet. The daily average is 16.63% below it. Both are correct averages. Neither can be used to manage a charge levied on a half-hour. The peak is not a large number sitting inside them; it is a number they have destroyed.
What happened at 07:00
Nothing unusual, which is the point. At 07:00 the shift starts and everything starts with it. The compressors come off idle. Four dye machines begin filling and heating. The chillers start cooling the sewing floor down. The knitting hall restarts after the overnight maintenance stop. Every light in the building goes on.
Nobody chose 07:00 for any of them. It is the time the gate opens.
Ghaith moved four things and nothing else:
- the two chillers start at 06:30, so they finish cooling the floor down before the shift rather than during it
- two of the four dye machines fill and heat from 08:00, the other two from 09:00
- the air compressors' second machine is held off until 07:45
- the warehouse and canteen lighting circuits come on from the same timeclock that lesson 2 fitted
| Sum of the twelve peaks | Mean peak | Annual demand charge, USD | |
|---|---|---|---|
| Before | 26,904 | 2,242 | 258,278.40 |
| Modelled after | 24,072 | 2,006 | 231,091.20 |
| Actually achieved | 25,344 | 2,112 | 243,302.40 |
The model said USD 27,187.20 a year. The plant achieved USD 14,976.00, which is 55.1% of it. The gap is not a modelling error. A staggered start is a standing instruction with nothing behind it, and by month four the second dye machine was going on at 07:20 again because the dyehouse was behind. The permanent submeter is what makes an instruction stick, and lesson 6 puts a number on that.
And the kilowatt-hours removed: none
Every one of those four changes moved a load. Not one removed a joule of it. The chillers run the same hours, the dye machines heat the same water, the compressors make the same air.
The other direction: the window that proves a change
The demand charge failed because the reporting interval was too long to see something that was real. Water at Zarqun failed in the opposite direction, and the arithmetic is the same arithmetic.
Zarqun draws 58,940 cubic metres a year. Monthly intake averages 4,911.67 cubic metres, and it varies. The number of dye loads in a month is not constant, so the day-to-day standard deviation of intake is 96 cubic metres. That makes a month's standard deviation 525.8, or 10.71% of the mean. (A standard deviation is just a measure of how far a reading normally sits from the average.)
Now ask the only question that matters about a reading interval: what is the smallest steady leak this comparison could ever prove?
A steady leak builds up in proportion to time. The ordinary wobble in the process builds up in proportion to the square root of time. So the longer the window you compare over, the smaller the leak that can climb out of the wobble. Taking two standard deviations as the bar for saying a change is real:
| Window compared over | Cubic metres an hour | Cubic metres a year |
|---|---|---|
| One day | 8.0000 | 70,080 |
| One week | 3.0237 | 26,488 |
| One month | 1.4606 | 12,795 |
| One quarter | 0.8386 | 7,346 |
| One year | 0.4187 | 3,668 |
Read the first row and then the last. A daily meter reading, read daily, cannot prove a leak smaller than 70,080 cubic metres a year, which is more than the whole site draws. The same readings added up over a year can prove one at 3,668.
It is not the reading interval that sets what you can detect. It is the length of the window you compare over. The mistake almost everybody makes is to look at the number at whatever interval the report happens to arrive in.
The leak that no window could ever prove
Lesson 5 finds a continuous loss at Zarqun of 1,180 cubic metres a year, which is 0.13470 cubic metres an hour.
Put it into the arithmetic above. To prove a leak that small against this factory's own variability you would need a comparison window of 3,527 days, or 9.7 years.
No reading frequency helps. No better meter helps within any sane budget. That loss is invisible to the intake meter by its very nature and always will be. The only instrument that ever found it was a water balance: every litre in, every litre accounted for, and the residue read as the answer. Lesson 5 builds it.
What you should be able to do now
- Find out what interval your supplier settles maximum demand on, and stop reporting demand at any other one.
- Separate the money you save by moving a load from the energy you save by removing one, and put them on different lines.
- Compute, from your own variability, the smallest steady change each comparison window can prove — before you promise anybody a detection.
- Specify reading frequency and comparison window as two different requirements, because they buy two different things.
Check yourselfYour energy manager reports a 6% cut in the electricity account. Your sustainability report for the same year shows consumption unchanged. Who is lying?Show the answer
Nobody. A settlement line — maximum demand, power factor, or a shift of the same total from a day rate to a night rate — falls without a kilowatt-hour moving, so the account drops while consumption does not. Both statements are true about different subjects. The failure is not in either number. It is that they were allowed to travel without labels, so somebody will eventually compare them and conclude one department is wrong.