Lessons · Lesson 4 of 5
Reading a number without believing its label
Five figures in the application whose label names a period, a population or a subject that the arithmetic underneath does not cover.
Lesson 4 of 5 · 26 min
The habit this lesson is trying to build
Every figure on a screen is a fraction with something underneath it. The thing underneath is the part nobody prints. A label tells you what somebody meant the number to be about. The arithmetic tells you what it is actually about. The two are not always the same thing. This lesson takes five real figures from the application and asks the same question of each. What exactly is being counted, and over what?
None of the five is a bug. Every one of them is a correct calculation with a label that is shorter than the truth. That is the ordinary way a reporting screen misleads a careful person.
One: on-time delivery counts shipments, not orders
The Performance report leads with on-time delivery. The query behind it reads the shipments table and keeps every shipment marked shipped or delivered. It joins each one to its order to find the planned ship date. A shipment counts as on time when its actual ex-factory date is on or before that planned date. Ex-factory means the day the goods left the gate.
So the unit being counted is a shipment. An order that leaves in three parts casts three votes.
Deduru's order ORD-1038 for Culzean Kids went out in three shipments. Two on the planned date, and one eleven days later, because the last colour came off the line short. For the buyer that is one late order. For this report it is two on time and one late.
Two: the shipments that cannot be judged leave the denominator
A shipment marked shipped with no actual ex-factory date recorded cannot be judged either way. The code does not guess, and it does not count it as on time. It goes into a third bucket, and the percentage is worked out over the other two only.
The report page shows all three. Beside the percentage there is a figure labelled with no ship date. Its sub-line reads: shipped, date not recorded.
The Dashboard shows two of the three. The Performance card carries the percentage, the on-time count and the late count. The shipments nobody can judge appear nowhere on it.
| Report page | Performance card | |
|---|---|---|
| On time | 3 | 3 |
| Late | 1 | 1 |
| Shipped, date not recorded | 1 | Not shown |
| On-time delivery | 75% | 75% |
Both screens are honest, and neither is complete. The percentage is right: three of the four that could be judged. What the card leaves out is that a fifth shipment left the building and nobody wrote down when.
Three: a period on the label is a claim about one number
The Performance report's sub-line reads: on-time delivery, then the percentage, then the count in brackets, then the words last six months.
Only one thing on that page covers six months, and it is the output bar chart. The on-time figure is worked out over every shipped and delivered shipment in the workspace, with no date limit at all. The defect table beneath it adds up every defect ever logged against every piece ever recorded, also with no date limit.
The phrase is worse than decorative, because it travels. Every export of this report writes a filter string into the log, and that string is the words period, colon, last six months. So the record of the download claims a window the file does not have.
Four: the defect rate is one number for the whole factory, for ever
The Dashboard's quality figures are two sums divided by one another. Every defect quantity ever logged, over every piece the floor has ever recorded.
- No date limit. A bad month two years ago is still in it.
- No order limit. A style you no longer make is still in it.
- No buyer limit. Both of Deduru's buyers are in the same fraction.
When nothing has been recorded, the rate is a dash with the words no production yet underneath, not a zero. That part is right, and it matters more than it looks. A rate of zero and a rate with nothing to divide by are different facts, and the screen keeps them different.
The colour rule is worth memorising, because it is stricter than people expect. Red at 5% or above. Amber at anything above zero. Green only at exactly zero. A factory running at a genuinely good rate will show amber on that card for ever. That is by design, not a threshold somebody forgot to set.
The same rate appears on the Performance report broken down per buyer, which is more useful. It is still over all history.
Five: the thirty-day line is a line about purchase orders
The briefing strip at the top of My Work carries a small chart with one label above it: last thirty days. There is no axis, no legend and no figure printed anywhere near it.
There is no exception-history table in this application. Nothing records what the board looked like yesterday. So the chart does not draw the history of your exceptions, because that history does not exist. It rebuilds the one signal that is fully date-stamped: purchase orders that were past their required-by date and not yet fully received, counted for each of the last thirty days. The receipt dates come from the goods-received notes.
Everything else on your board is absent from the line: milestones, approvals, corrective actions, blockers and payments.
Two more things follow from that.
- A purchase order still in draft, or one with no required-by date, is not in the line at all. The count starts the day after required-by.
- If your factory receives goods in its own ERP rather than in this application, there are no goods-received notes at all. ERP is the accounting and stock system a company runs its books on.
- Nothing can then ever show as received, so every issued purchase order would read as late for ever.
- Rather than draw that, the code produces thirty zeros and raises a flag saying there is no history. The screen does not read the flag. It draws the flat line.
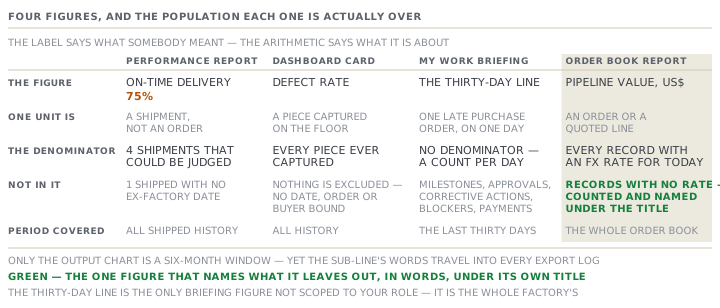
The chart is also the one part of that briefing strip that is not scoped to your role. Your fires, your chores and your affected-order count are all filtered to what you are shown. The line is the whole factory's late purchase orders, on everybody's screen, including the accounts that are never shown a purchase order.
The honest residual on the order book
One number in this application does the opposite, and it is worth ending on.
The order book converts every order and every quoted line into US dollars using the factory's own rates. If a record is in a currency with no rate for today, it is not converted at a guessed rate, and it is not quietly dropped. It is counted, and that count is printed in the grey line under the report title: so many records without an FX rate, not in totals. FX is foreign exchange, the rate one currency converts into another at.
That sentence is the model. It names the thing that is missing, says how many, and says what it is missing from. The headline figure above it still does not carry the warning, so a reader who takes the big number and ignores the small line will still be slightly wrong. But the information is on the page, in words, before anybody asks.
Check yourselfChamath reads 92% on-time delivery on his Performance card and repeats it to Ossington and Vale. Name two ways that sentence could be wrong in the buyer's eyes even though the figure is correct.Show the answer
First, it counts shipments and not orders. So an order that went out in four parts with three on time is mostly good news here, and a late order to the buyer. Second, it leaves out every shipment whose actual ex-factory date was never recorded, and the card does not show how many those were. The report page does. One more also counts: the figure is over all shipped history, not the recent period the buyer probably has in mind.
Prompt · Ask the denominator questions before I quote a figure
Before you repeat any percentage from a dashboard or a report to somebody outside your own team.
Interrogate a figure I am about to quote, before I quote it.

I will tell you the figure, the screen it came from, and who I am about to say it to.

Work through five questions in order and answer each one before moving on.

One. What is the unit being counted. Orders, shipments, pieces, records, or something else. If I do not know, say that not knowing is itself the answer to whether I should quote it.

Two. What is in the denominator, and what has been excluded from it. Ask specifically about things that could not be judged and were dropped rather than counted as good.

Three. What period does it cover. Then ask whether the period named on the label is the period the arithmetic used, and tell me how I could check.

Four. Who is it about. One buyer, one order, one line, or the whole factory since it opened.

Five. What would the person I am talking to assume the answers were. Where their assumption differs from the truth, write the half-sentence I should add so the figure stays honest.

Then give me the figure back as one sentence I can say out loud, with its unit, its period and its scope in it. If any of the five is genuinely unknown to me, put the word unknown into that sentence rather than smoothing it over.
AI can make mistakes — check anything you act on.